3. New Reports
New Reports:
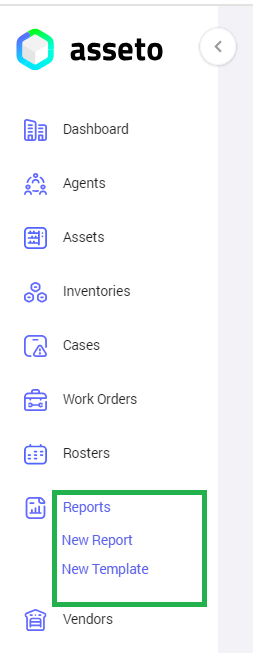
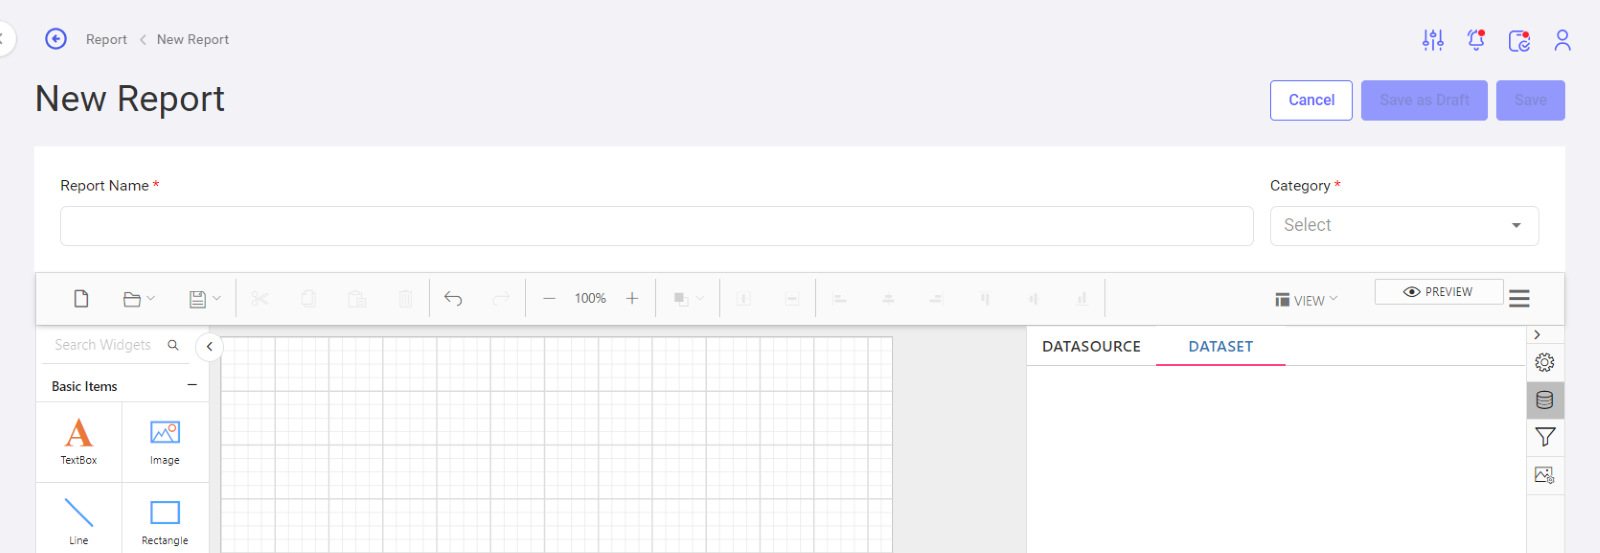
Generate new report by navigating to Reports >> New Report
New Report Creation Page:
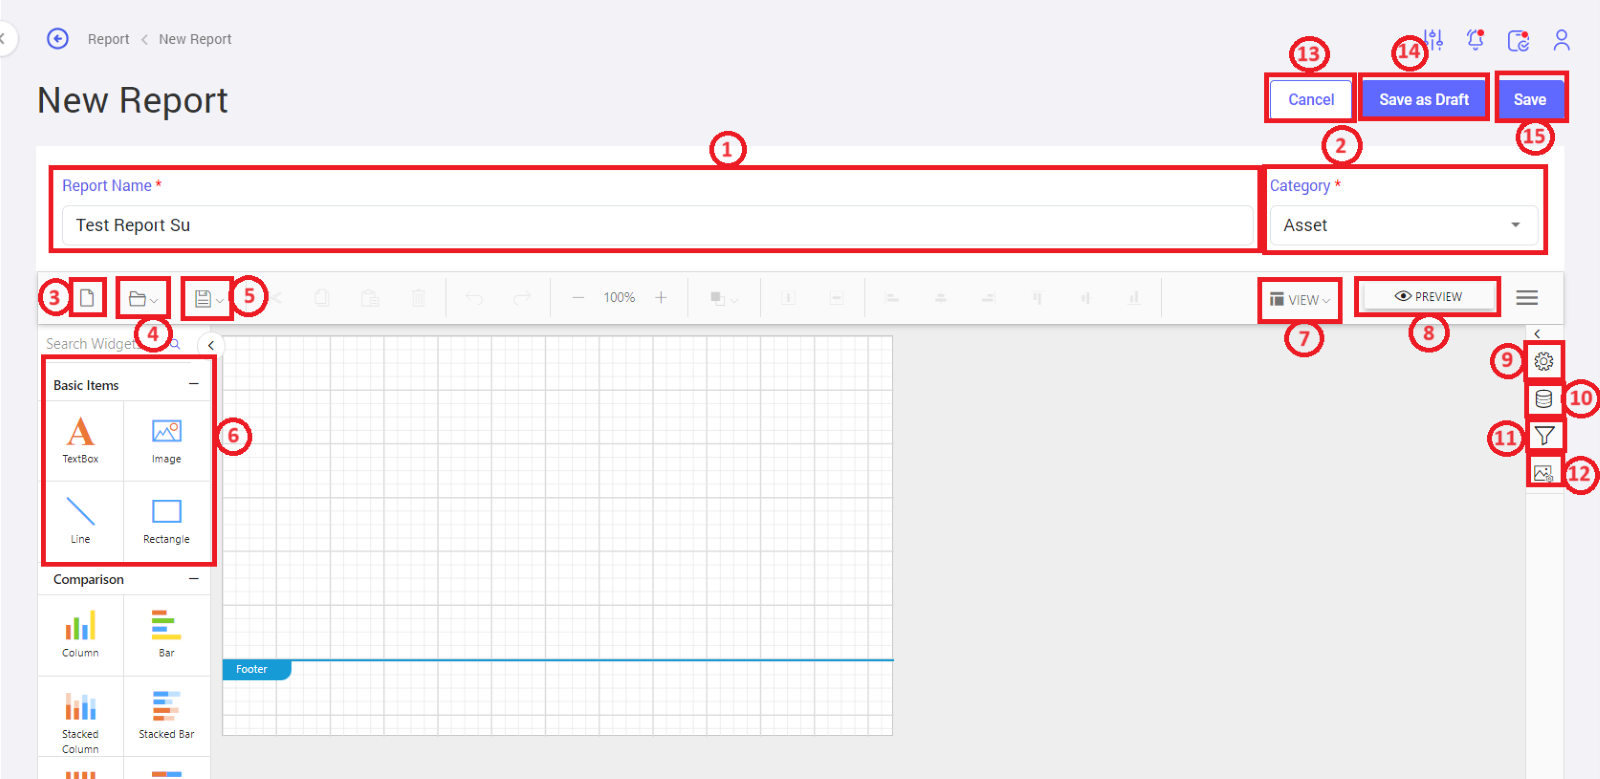
- Report Name: To define the report name.
- Category: To select the category for which the report needs to be generated.
- New: To create a new report.
- Browse Icon: To upload a file from the device or server.
- Save Icon: To save file / save as to device or to server.
- Widgets: To provide flexibility to Users to select the Widgets to display the data.
- View: User view options are displayed in the list. The options are Header, Footer, Grid Lines, Snap to Shape, Full Screen.
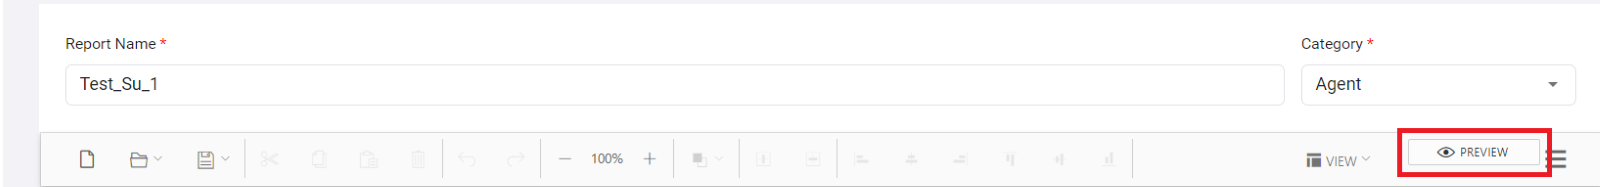
- Preview: To preview the report.
- Settings Icon: To do settings as required. Ex: Basic settings, margin, background image etc.
- Data Base Icon: To create new data source & new data sets.
- Parameters: To add filter parameters required for report extraction.
- Image Manager: To add images.
- Cancel: To cancel the report creation process.
- Save as Draft: To save a report as draft.
- Save: To save the report.
Create New Data Source:
To create new data source, navigate to Database icon >> Data source>> New data source. 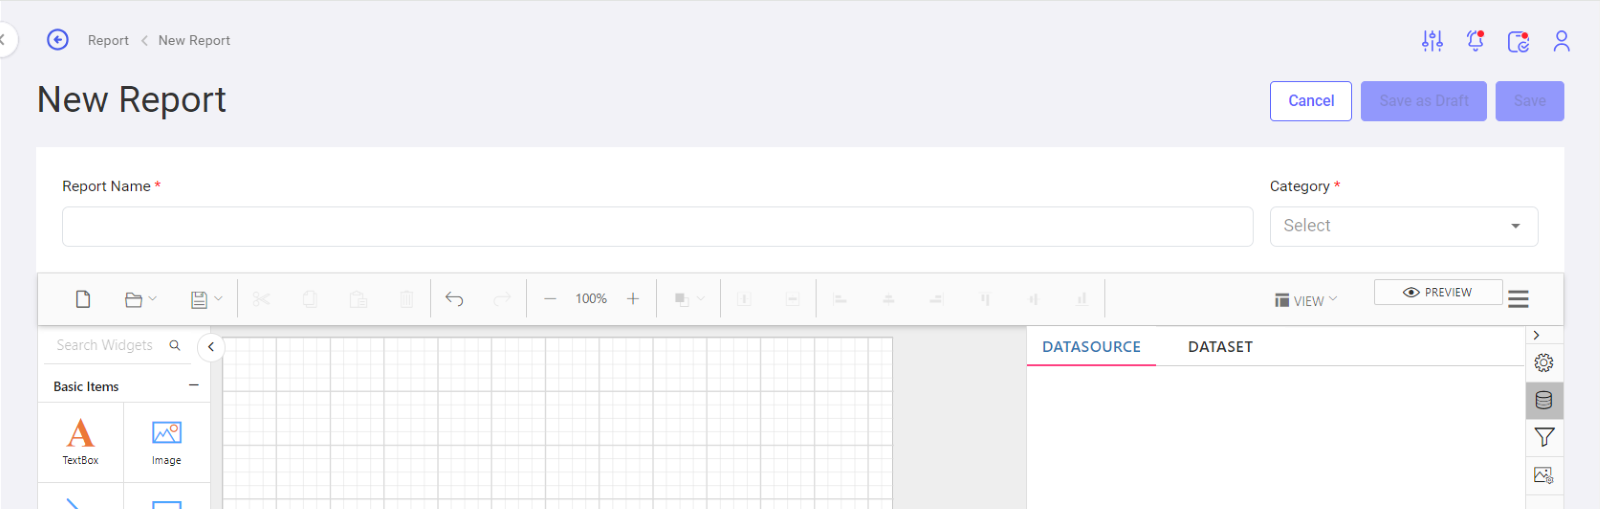
Click on the option highlighted in the image.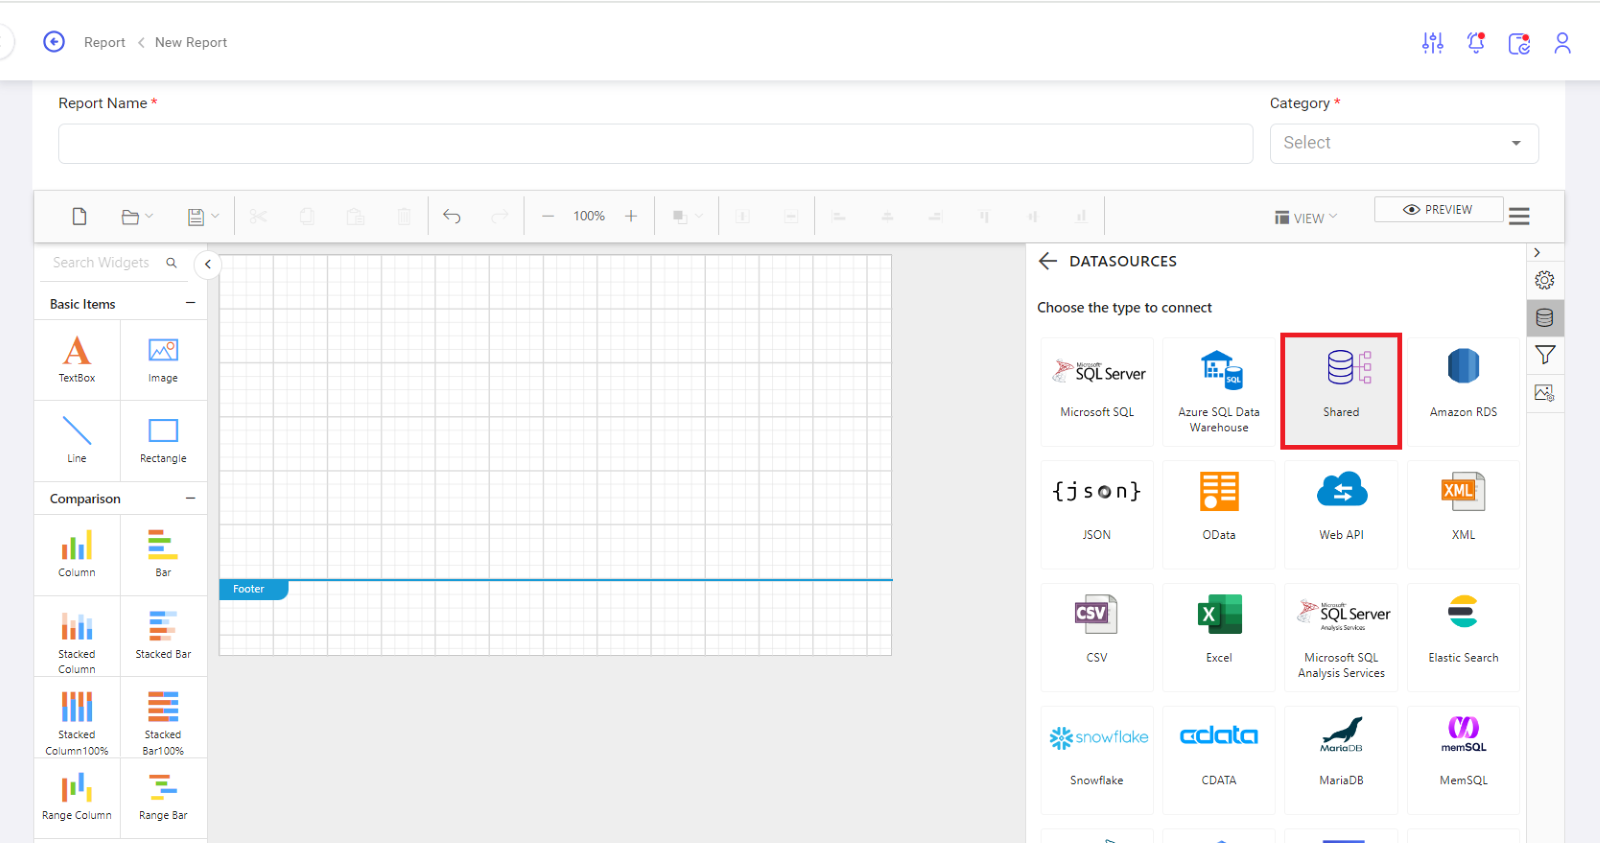
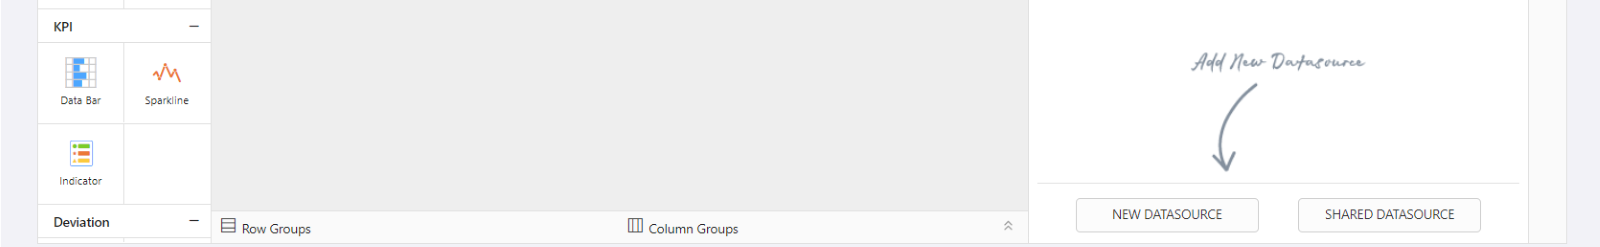
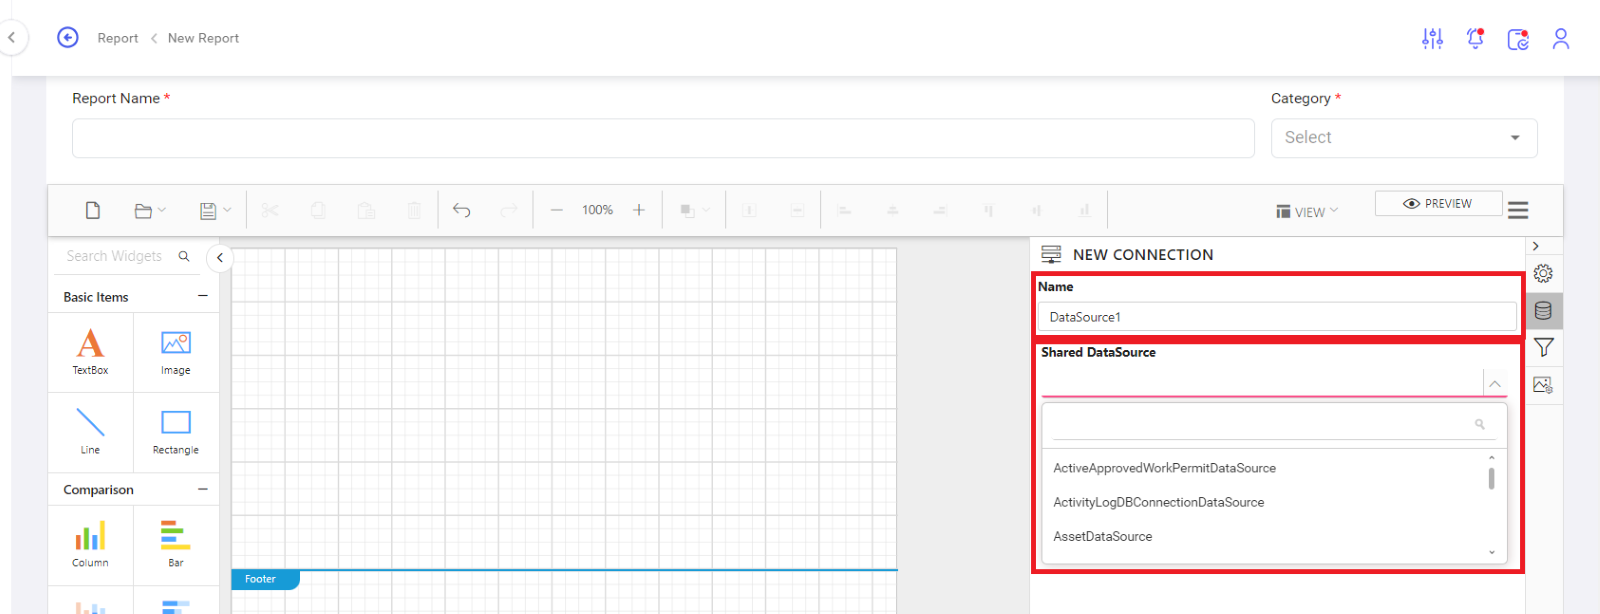
Define the Data source name in a free text field or select the data source from the drop-down menu which is created at the backend & displayed. The data sources are created for all the modules. Clicking on the Save icon will save the Date sources & cancel icon discard the creation process.
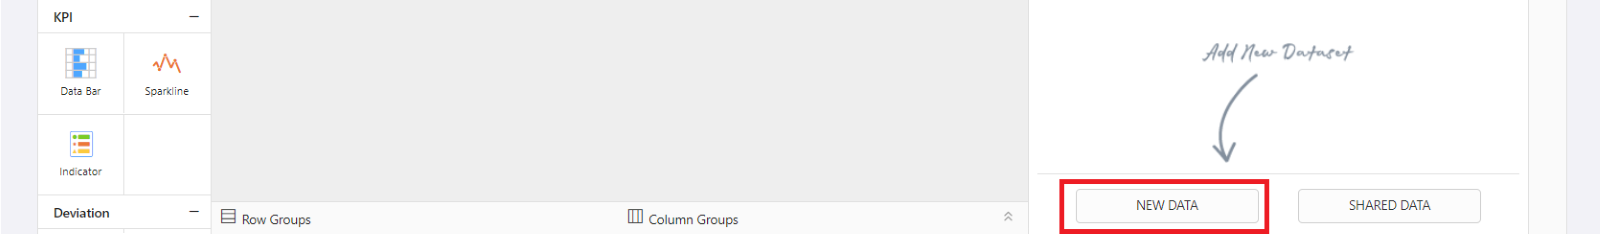
Create New Data Sets:
Click on the new data as shown in the image to add a new data set.
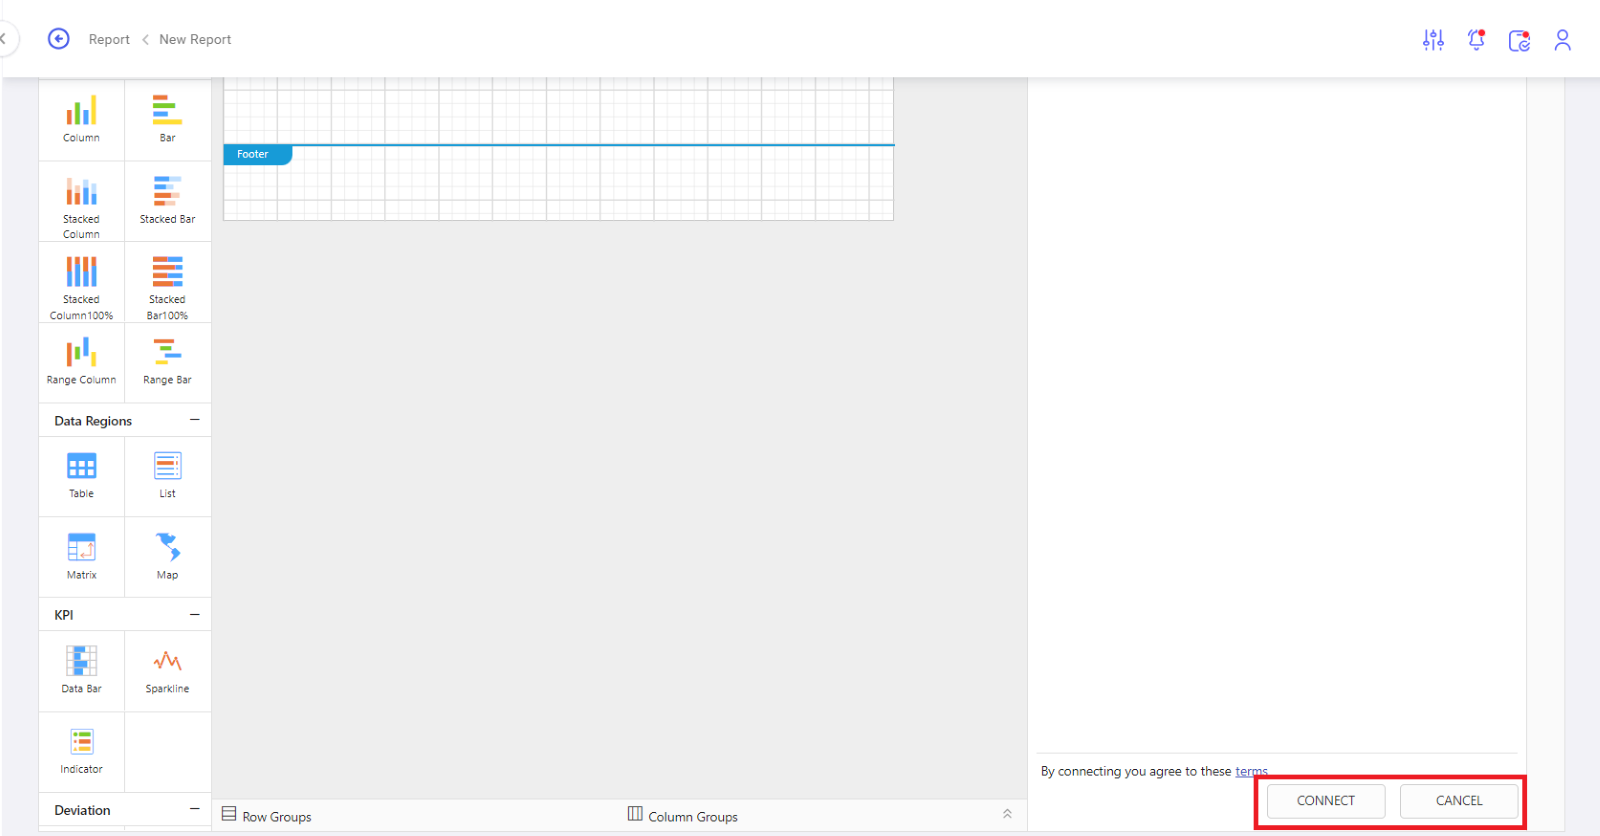
Click on the Shared option shown in the below image.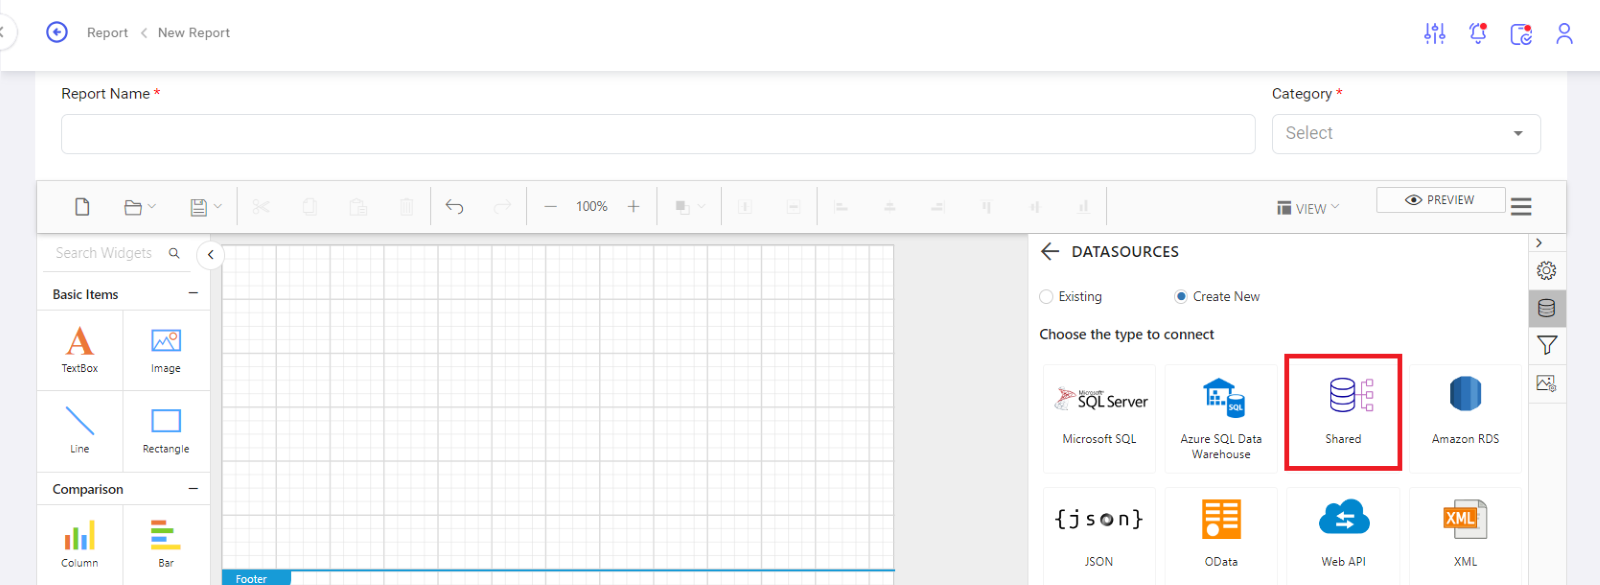
Define the Data source name in a free text field or select the same data source from the drop-down menu which is created at the backend & displayed. Clicking on the Connect icon will connect the Dats sets with Data source & cancel icon discard the creation process.
Date set's view in left side panel. User can drag & drop the required data sets / fields to be shown in the report. 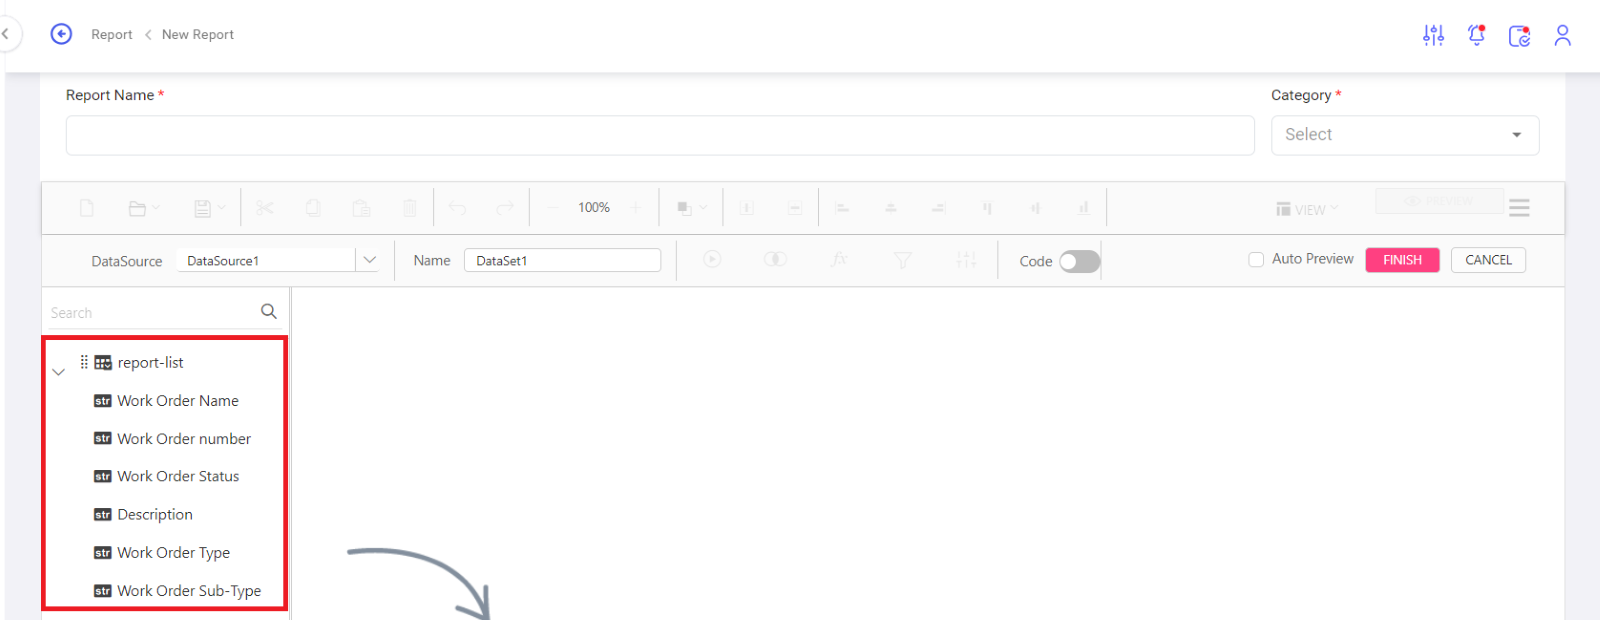 Data source to be added to the right panel. To do that:
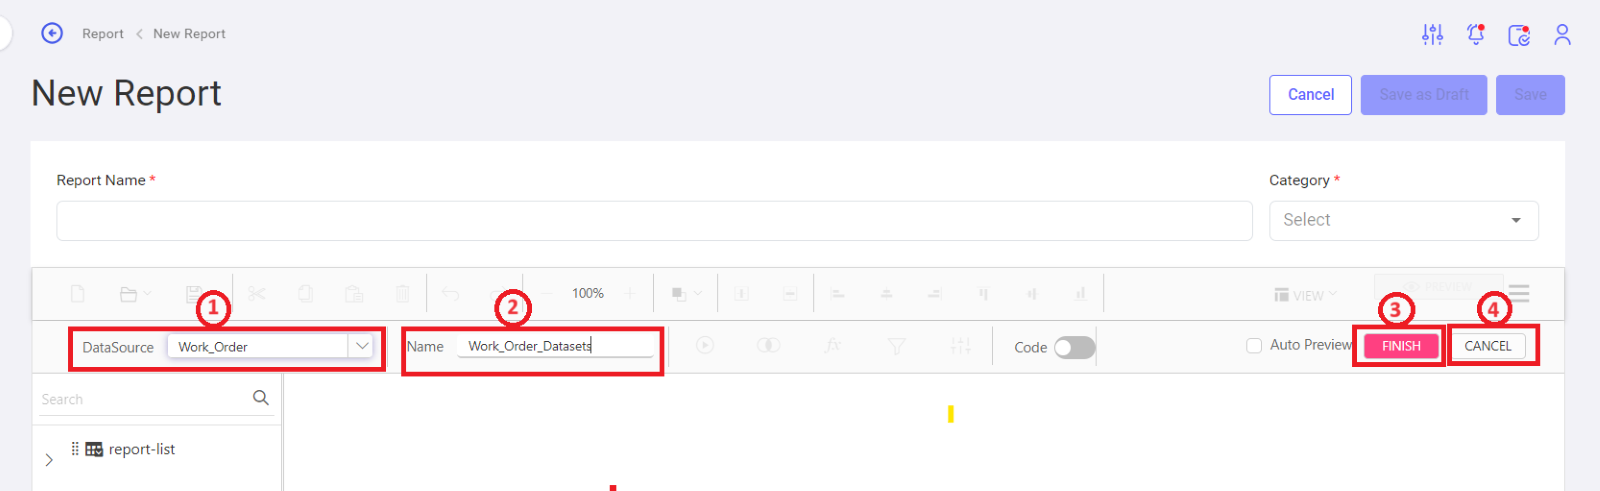
- Data Source: Select the Data source that has been added.
- Name: Define the name.
- Finish: To complete the process.
- Cancel: To discard the process.
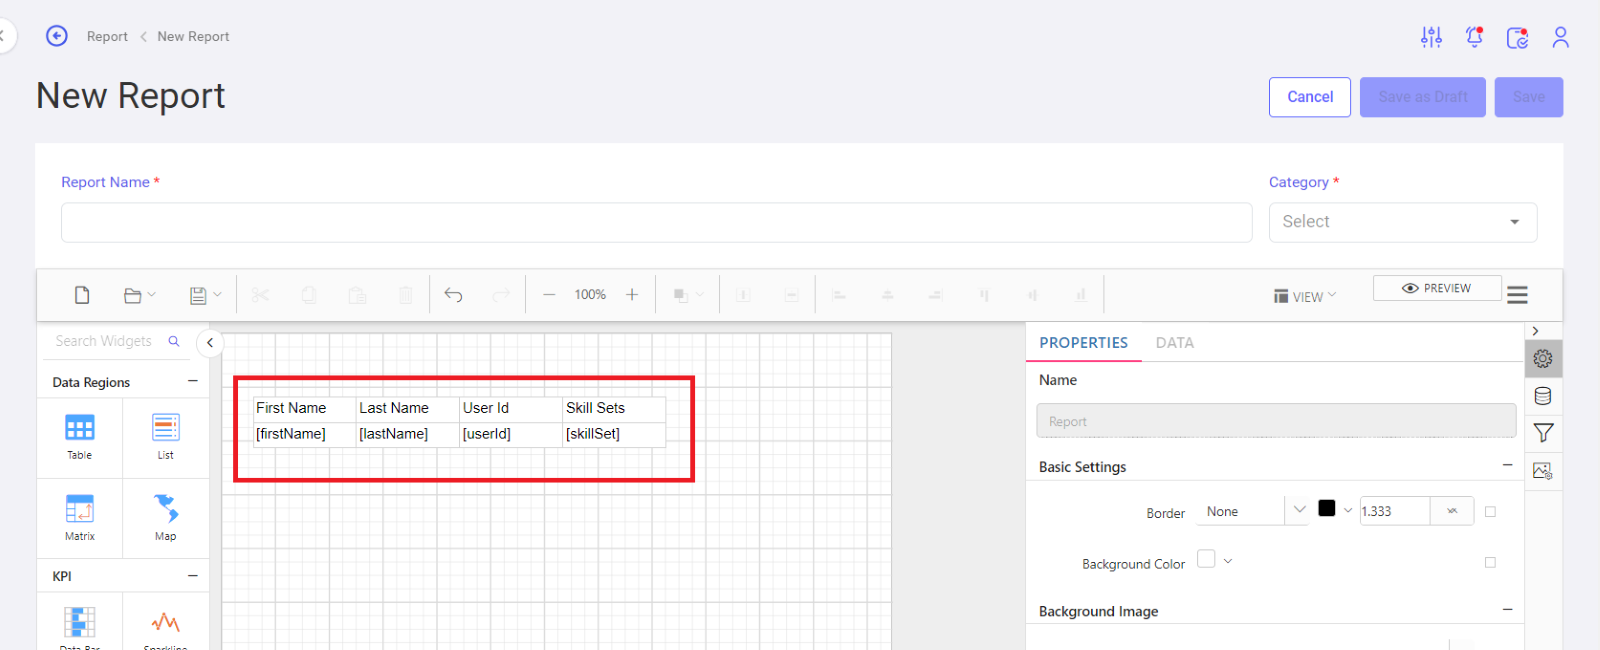
Format Drag & drop:
Drag & drop the format from the widgets required to generate the report. Ex: Table. Then select the field / data sets. If the User wants more columns / rows, or any additional features, they are being provided with more flexibility to use the features.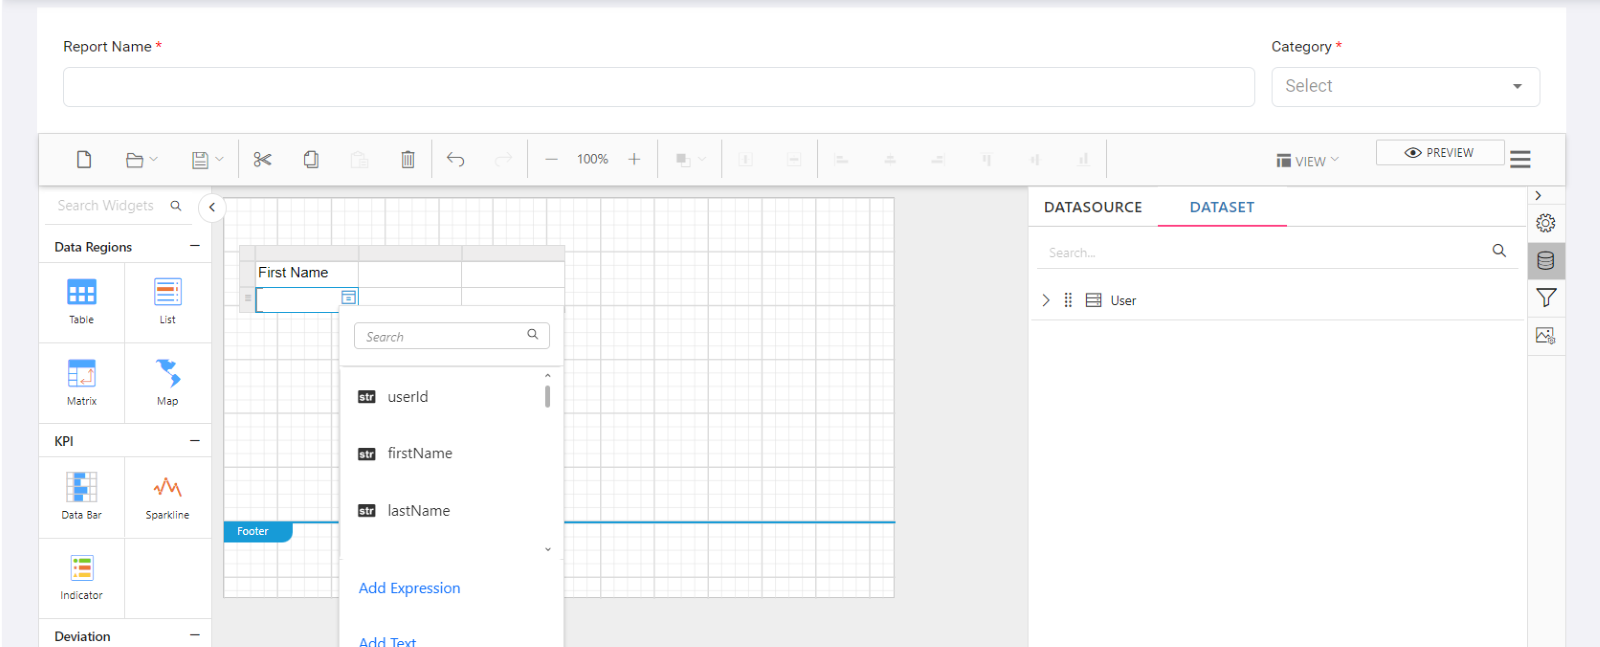
Change the Header of the column: 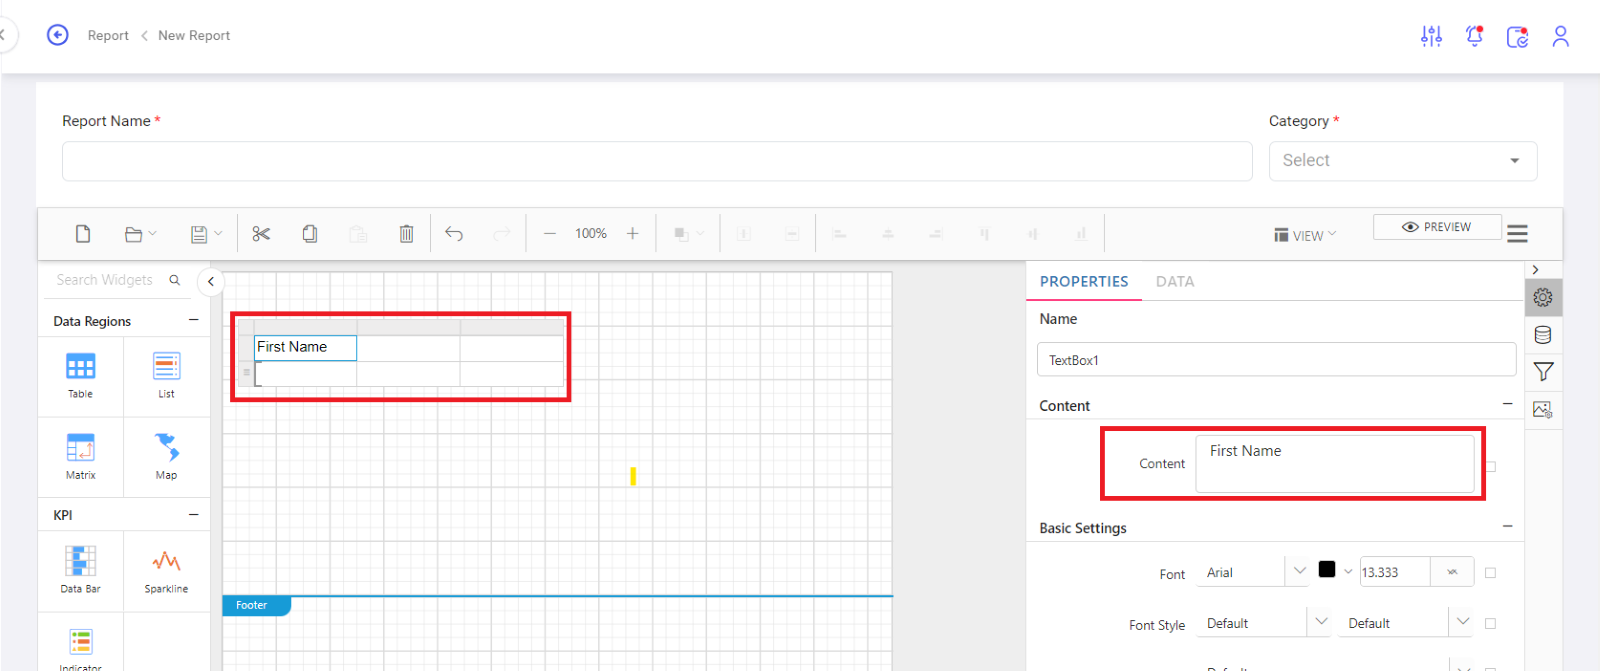
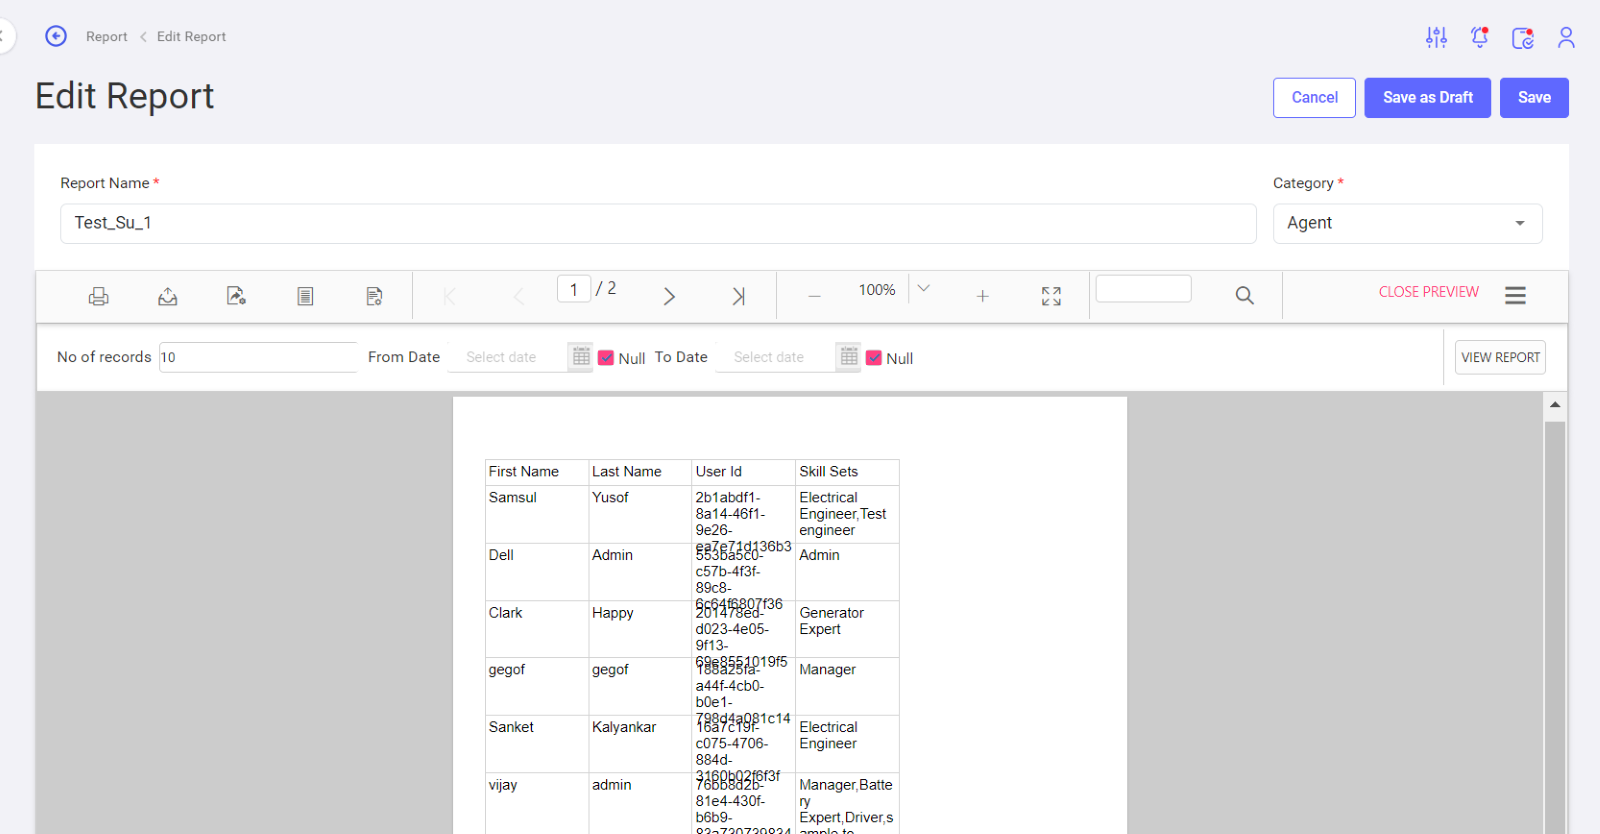
Preview:
Click on the Preview option to view the details.