1.1. Dashboard Features
The Dashboard includes the following features:

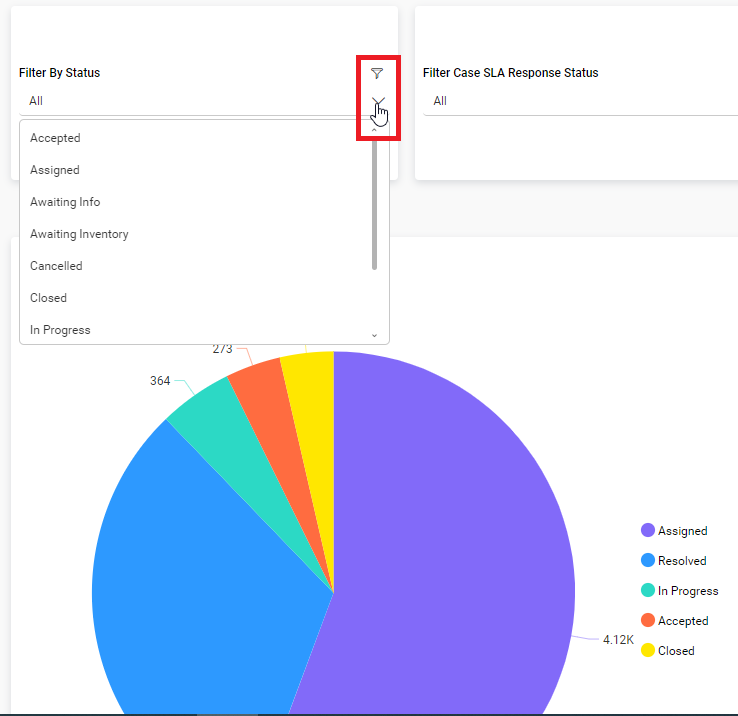
1.0 Filter By WO Status
Users can filter work order statuses by selecting one of the following options from a dropdown menu: Assigned, Accepted, In-Progress, Rejected, or Closed. The filtered work order statuses are then displayed in the pie chart below.
Click on filter icon to clear filter.
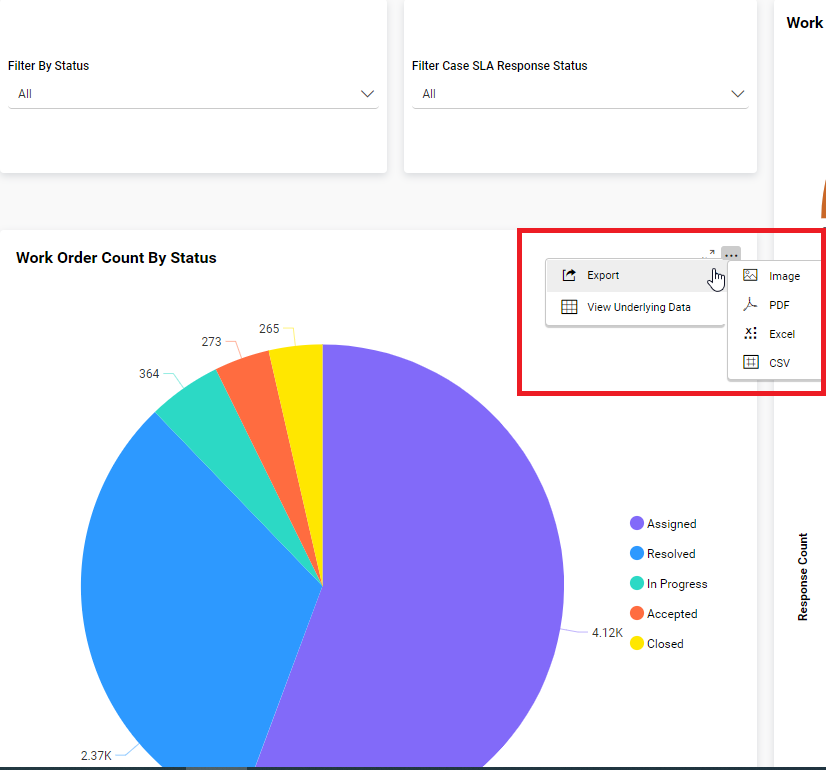
1.1 Work Order Count By Status pie chartchart:
When theyou user hovershover over the pie chart with theyour mouse, you will see icons for ‘More Options’ and ‘Maximise’Maximize’. will appear. By clickingClick on the ‘More Options’ icon,icon the user canto view options for ‘Export’ (to export Workwork Orderorder Count By Status data in formats such as image, PDF, Excel, or CSV) and ‘View Underlying Data’, as shown in the screenshot below.

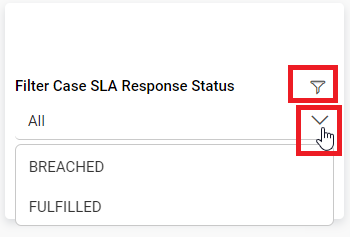
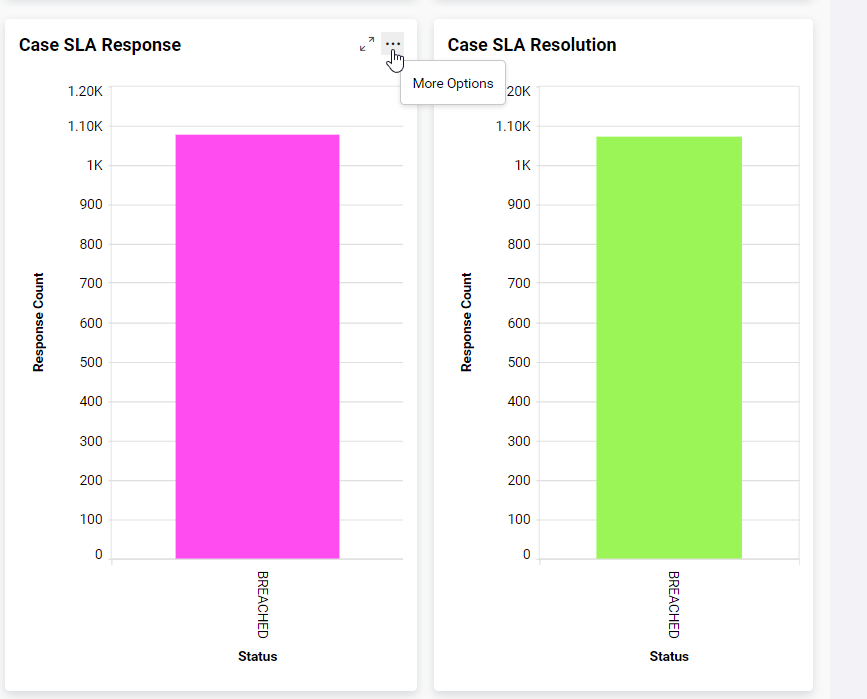
2.0 Filter Case SLA Response Status

The user can filter the Case SLA Response Statuscount by selecting one of the statuses, such as fulfilled or breached, from the dropdown menu. The filtered status is displayed in the bar chart below.
Click on filter icon to clear filter.

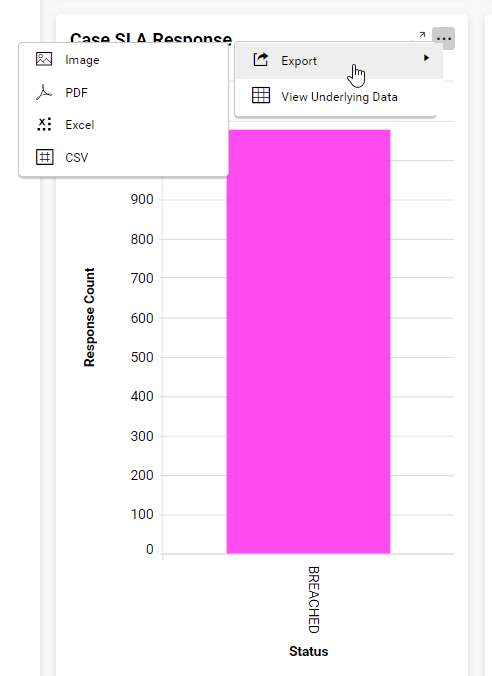
2.1. Case SLA Response
When the user hovers over the bar chart with the mouse, icons for ‘More Options’ and ‘Maximise’ will appear. By clicking on the ‘More Options’ icon, the user can view options for ‘Export’ (to export Case SLA Response data in formats such as image, PDF, Excel, or CSV) and ‘View Underlying Data’, as shown in the screenshot below.

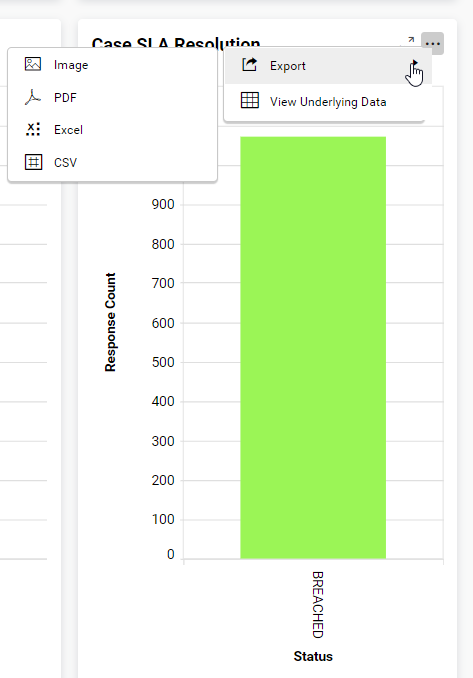
2.2. Case SLA Resolution
When the user hovers over the bar chart with the mouse, icons for ‘More Options’ and ‘Maximise’ will appear. By clicking on the ‘More Options’ icon, the user can view options for ‘Export’ (to export Case SLA Resolution data in formats such as image, PDF, Excel, or CSV) and ‘View Underlying Data’, as shown in the screenshot below.
3.02. WorkFilter OrderCase SLA Response BreachedStatus:
User can filter the Case SLA Response Status by selecting any one of status like, fulfilled, breached from dropdown. Filtered status shown by below bar chart.
Click on filter icon to clear filter.
2.1. Case SLA Response:
When theyou usermouse hovers overhover the bar chart withyou can view the mouse, icons for ‘More Options’ and ‘Maximise’Maximize’. will appear. By clickingClick on the More Options icon on the bar chart, you view the options for ‘Export’ (to export Case SLA Response data like, image, pdf, excel, csv) and ‘View Underlaying Data’ as shown by below screenshot.
2.2. Case SLA Resolution:
When you mouse hover the bar chart you can view the icons for ‘More Options’ icon,and ‘Maximize’. Click on the userMore Options icon on the bar chart, you view the options for ‘Export’ (to export Case SLA Resolution data like, image, pdf, excel, csv) and ‘View Underlaying Data’ as shown by below screenshot.
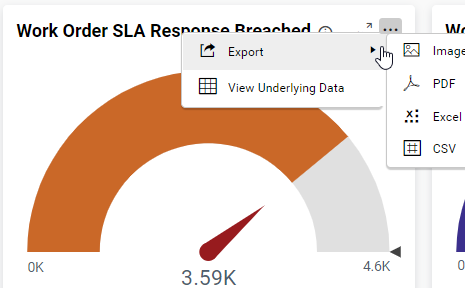
3. Work Order SLA Response Breached:
When you mouse hover the chart you can view the icons for ‘More Options’ and ‘Maximize’. Click on the More Options icon on the bar chart, you view the options for ‘Export’ (to export Work Order SLA Response Breached data in formats such aslike, image, PDF,pdf, Excel,excel, or CSV)csv) and ‘View UnderlyingUnderlaying Data’, as shown inby thebelow screenshot below.screenshot.
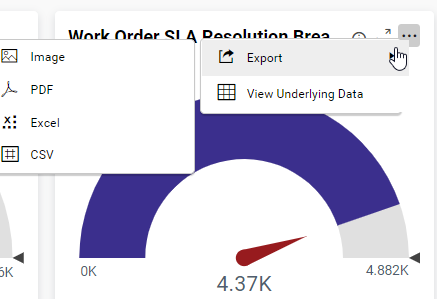
4.04. Work Order SLA Resolution Breached:
When theyou usermouse hovers overhover the chart withyou can view the mouse, icons for ‘More Options’ and ‘Maximise’Maximize’. will appear. By clickingClick on the ‘More Options’Options icon for on the bar chart, the user canyou view the options for ‘Export’ (to export Work Order SLA Resolution Breached data in formats such aslike, image, PDF,pdf, Excel,excel, or CSV)csv) and ‘View UnderlyingUnderlaying Data’, as shown inby thebelow screenshot below.screenshot.
5.0
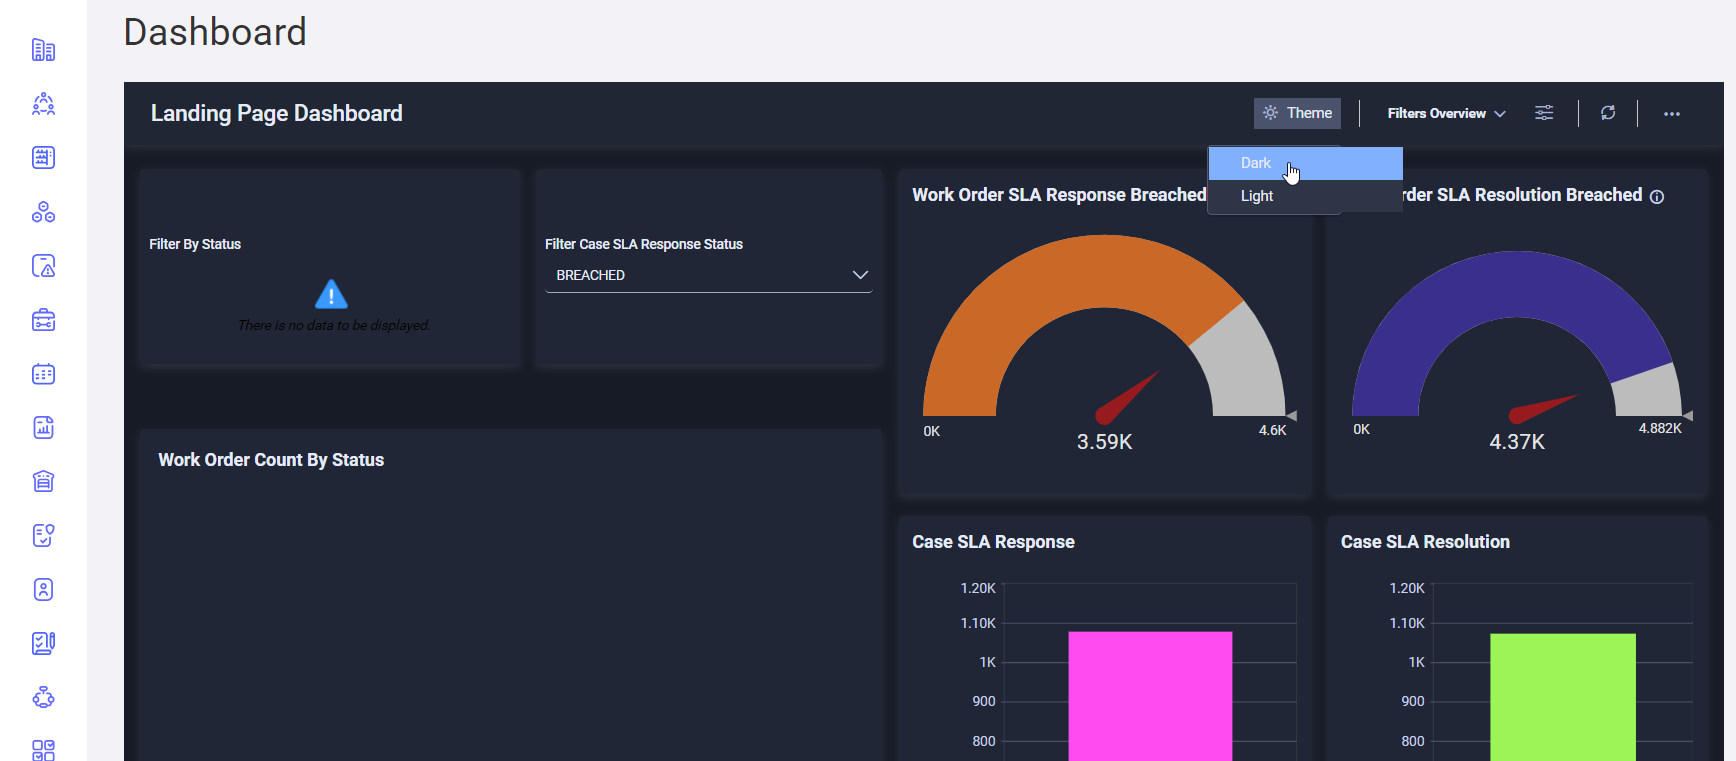
5. Theme:
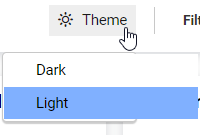
When theyou user clicksclick on the dark mode, you can view the dashboard will be displayed in dark mode,mode as shown in theby following screenshot.
6.06. Dashboard Parameters:
When theyou user clicksclick on this icon, theicon following page will appear.appear, Here,here the useryou can adjust thechange dates as neededper your need and click on the ‘Apply’ button.button, The graphgraphs data will be updated in the dashboard will be updated based on the selected date range.

7.07. Refresh:
When thewe click on refresh icon (locatedavailable nextbeside to theof dashboard parameters icon) is clicked, the dashboard graphs will be updated with the latest data.
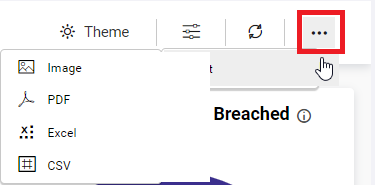
8.08. List Icon:
Whenwhen theyou user clicksclick on the ‘Options’option’ icon, they will be able to download the dashboard ininto multiple formats,formats such aslike image, PDF,pdf, Excel, andexcel, CSV,csv as shown in theby following screenshot.