8. Reports
1. Overview
Overview:
Reports are a form of an official documents, or a statement consists of information's based on User requirements. Users can extract the data using a pre-built template to extract customize it.
2. Reports Dashboard
Reports Dashboard:
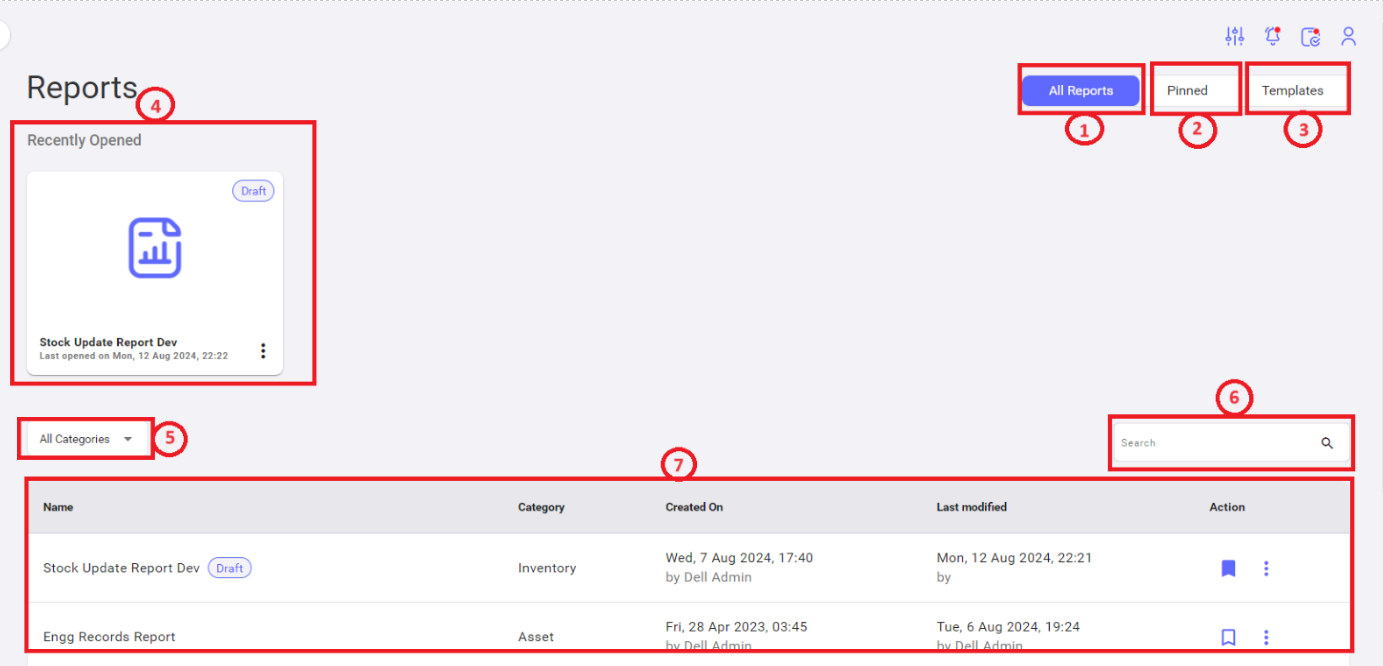
- All Reports: To view all reports in the dynamic table.
- Pinned: To view only pinned reports in the dynamic table.
- Templates: To view the report templates. Users can view the report template available in the system and customize it as needed.
- Recently Opened: To view recently opened reports.
- All Categories: To filter the list view based on Categories. List of Categories involves, Agent, Asset, Inventory, Case, e-PTW, Work Order, Visitor Pass.
- Search: To view specific record.
- List View: To view the list of reports in a dynamic table.
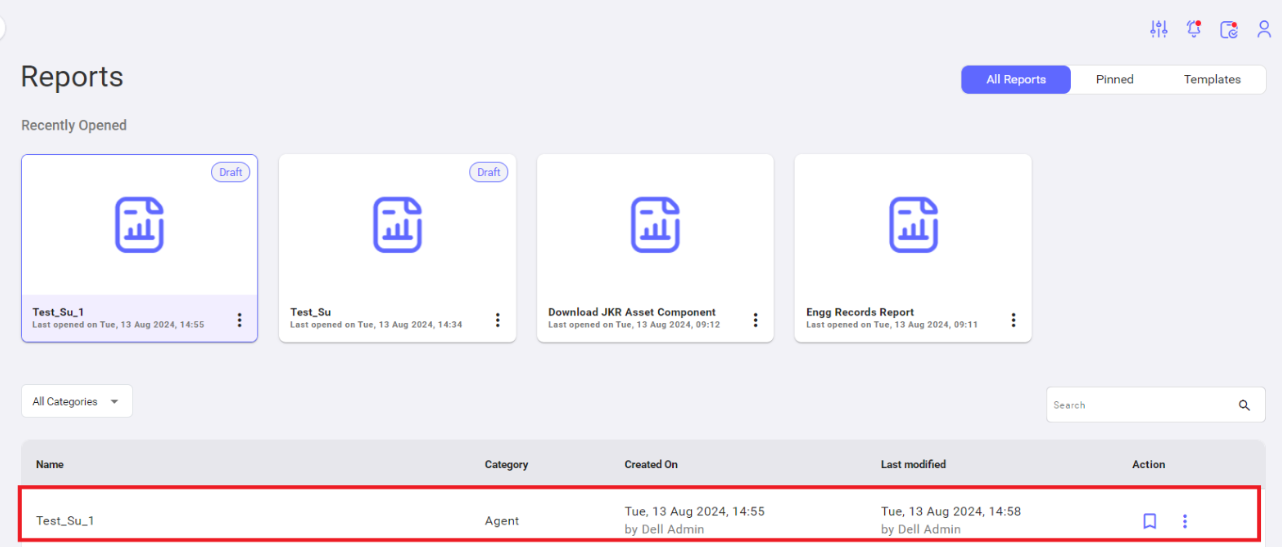
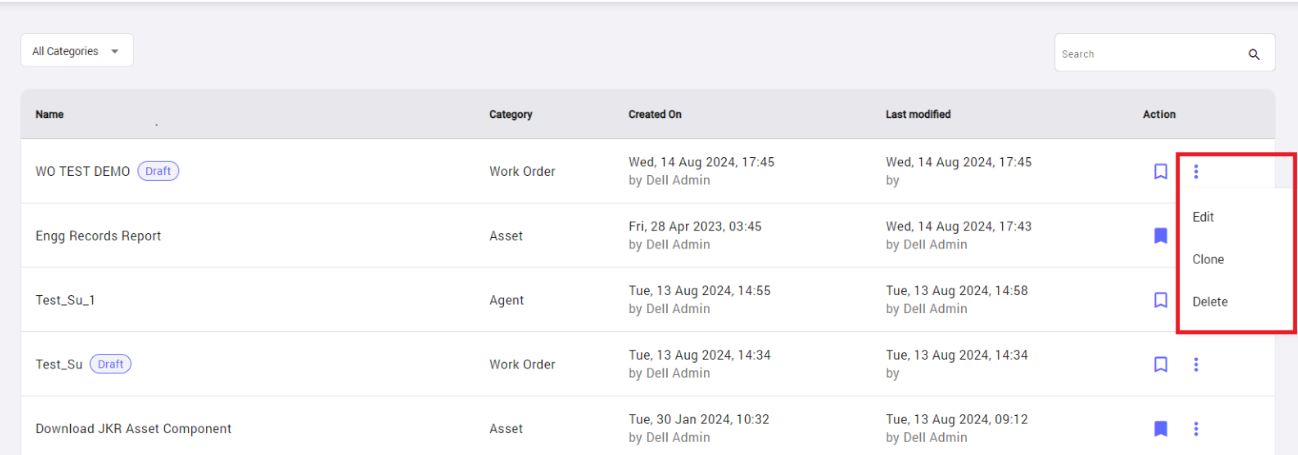
All Reports View:
Users click on All Reports to view all the reports generated in an application.
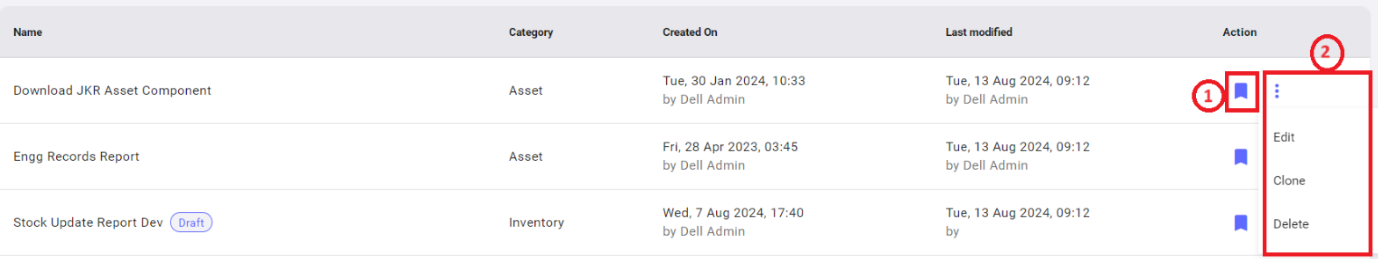
- Flag Icon: Click on this flag icon to pin the report.
- 3 Dots Icon: Click on to 3 dots icon to perform edit / delete actions or clone the report.
Pinned Reports View:
This page displays all pinned reports.
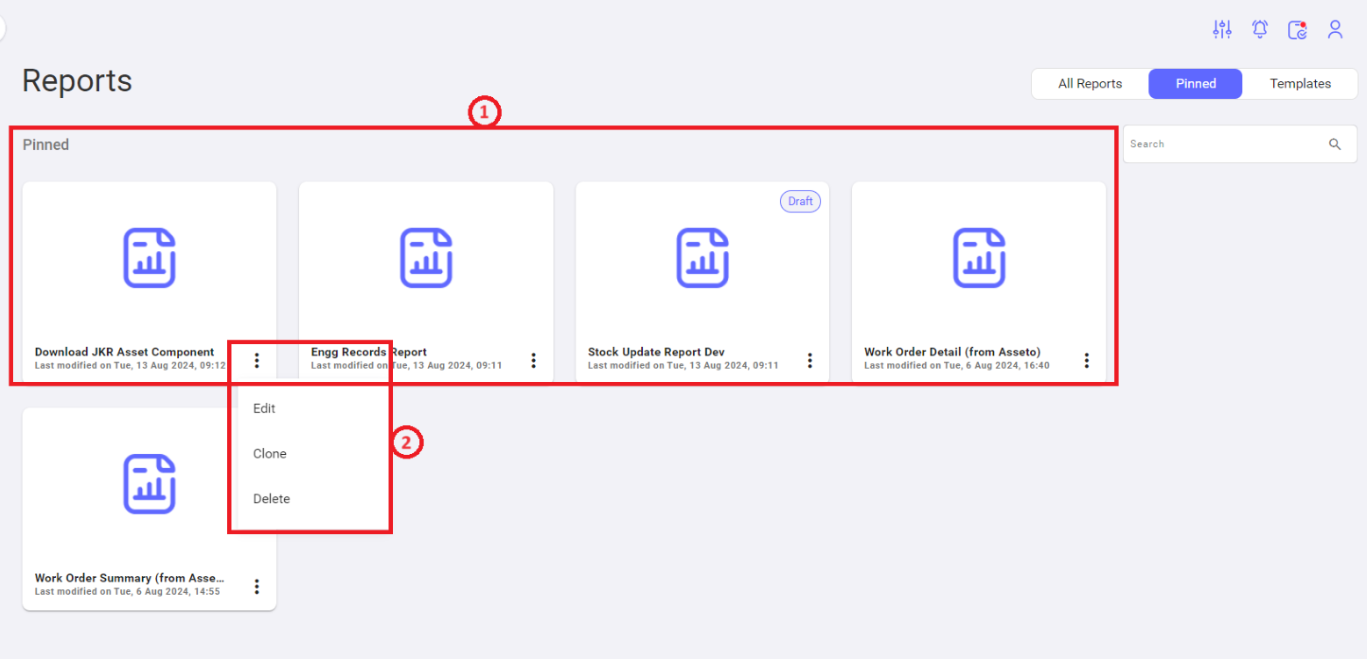
- Pinned Reports: Displays all the pinned reports.
- 3 Dots Icon: Users can edit, delete or clone the report.
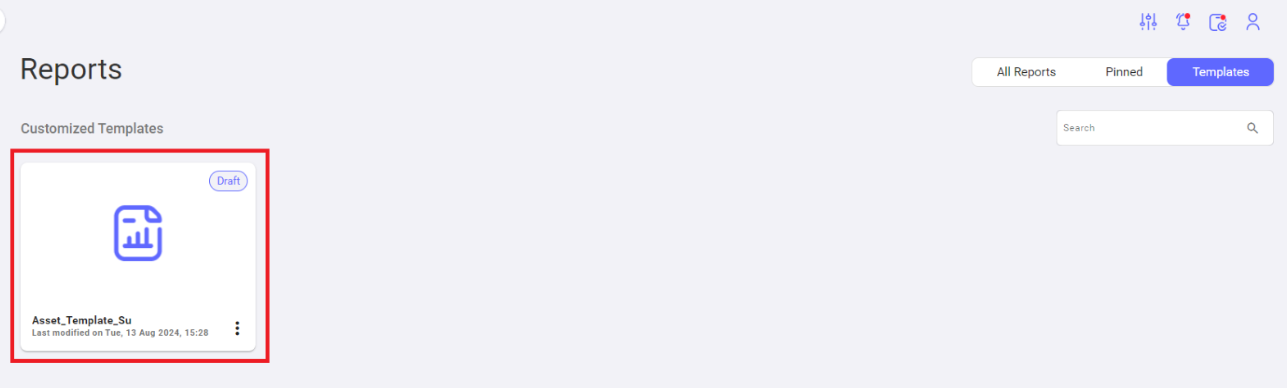
Templates Page View:
This page displays all the templates for Users.
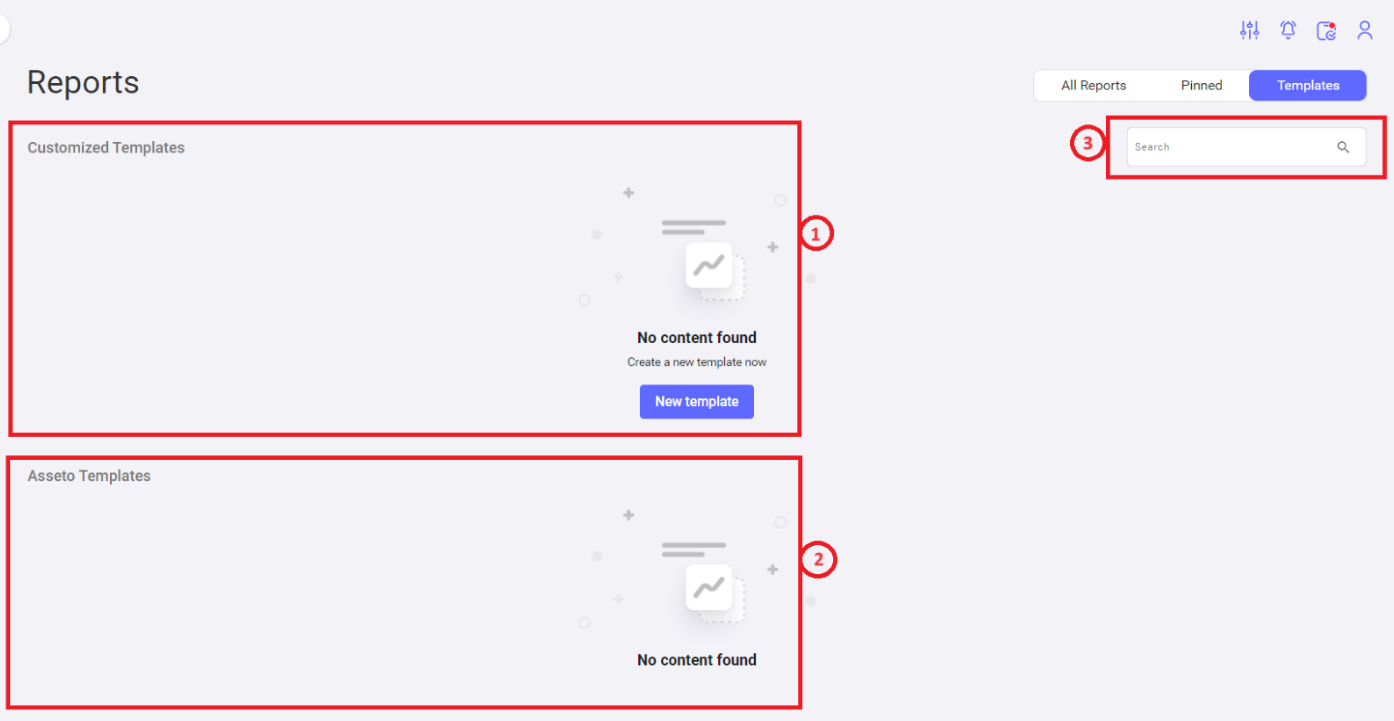
- Customized Templates: Displays the templates customized by Users.
- Asseto Templates: Displays pre-defined templates.
- Search: To search specific templates.
3. New Reports
New Reports:
Generate new report by navigating to Reports >> New Report
New Report Creation Page:
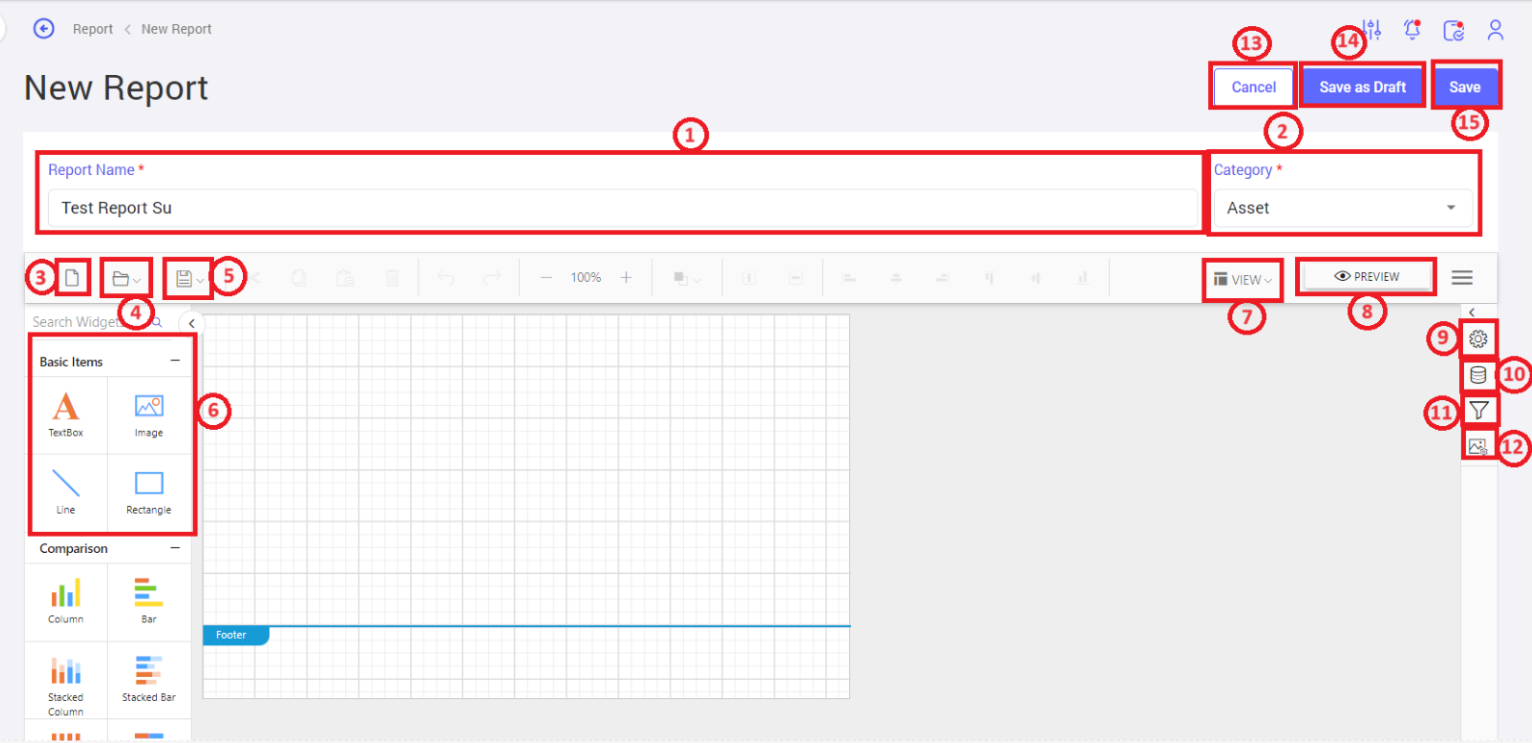
- Report Name: To define the report name.
- Category: To select the category for which the report needs to be generated.
- New: To create a new report.
- Browse Icon: To upload a file from the device or server.
- Save Icon: To save file / save as to device or to server.
- Widgets: To provide flexibility to Users to select the Widgets to display the data.
- View: User view options are displayed in the list. The options are Header, Footer, Grid Lines, Snap to Shape, Full Screen.
- Preview: To preview the report.
- Settings Icon: To do settings as required. Ex: Basic settings, margin, background image etc.
- Data Base Icon: To create new data source & new data sets.
- Parameters: To add filter parameters required for report extraction.
- Image Manager: To add images.
- Cancel: To cancel the report creation process.
- Save as Draft: To save a report as draft.
- Save: To save the report.
Create New Data Source:
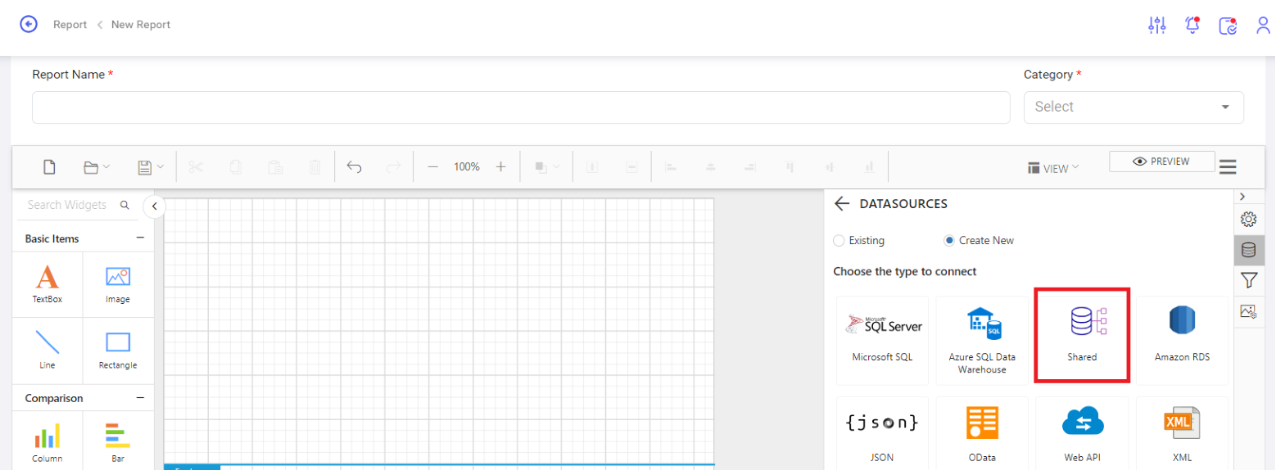
To create new data source, navigate to Database icon >> Data source>> New data source.
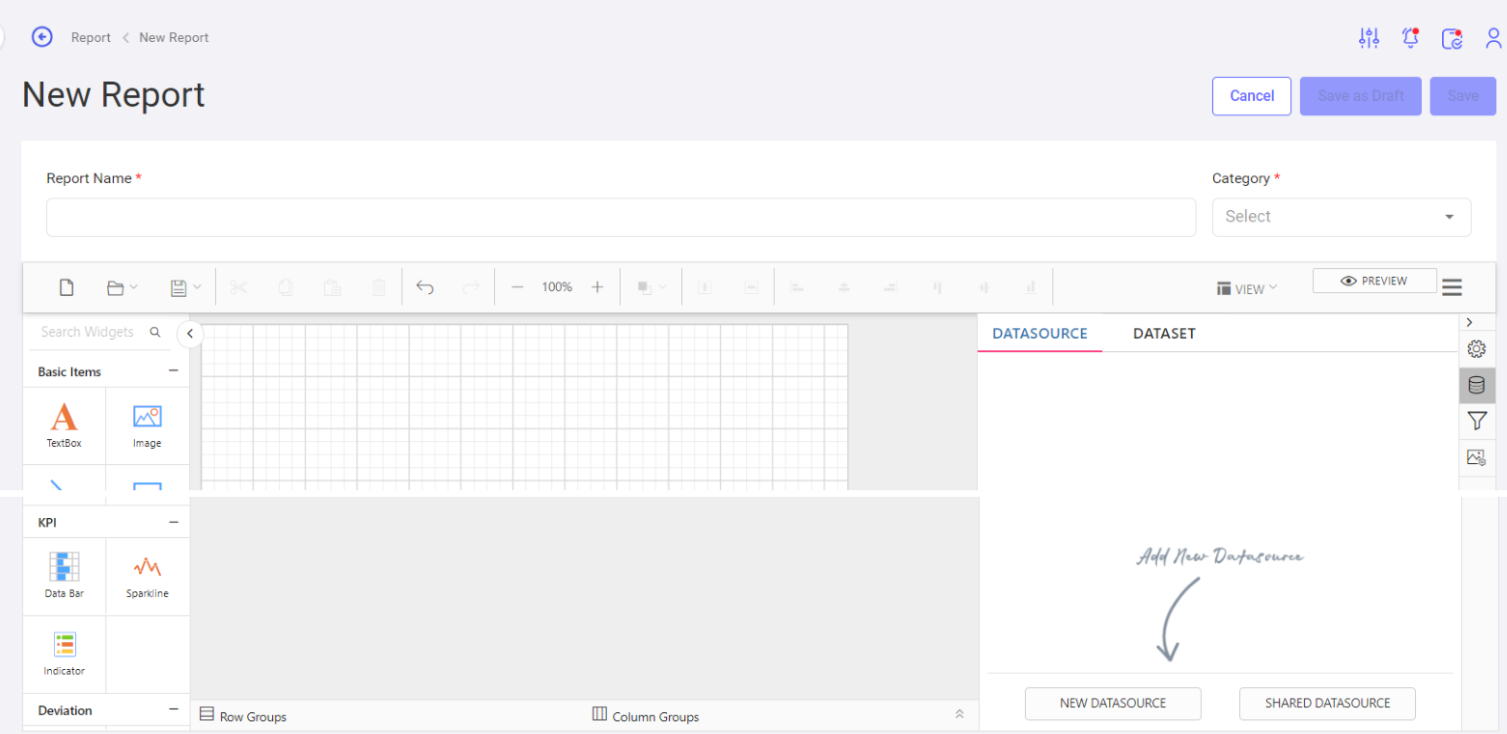
Click on the option highlighted in the image.
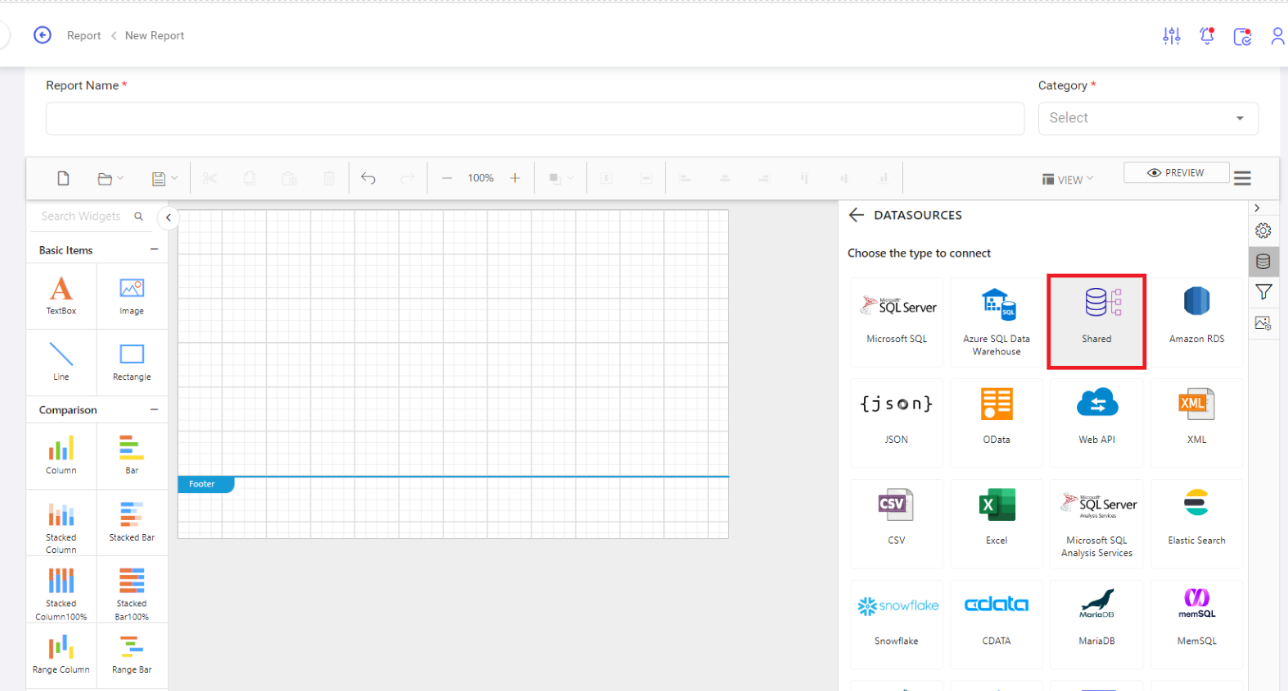
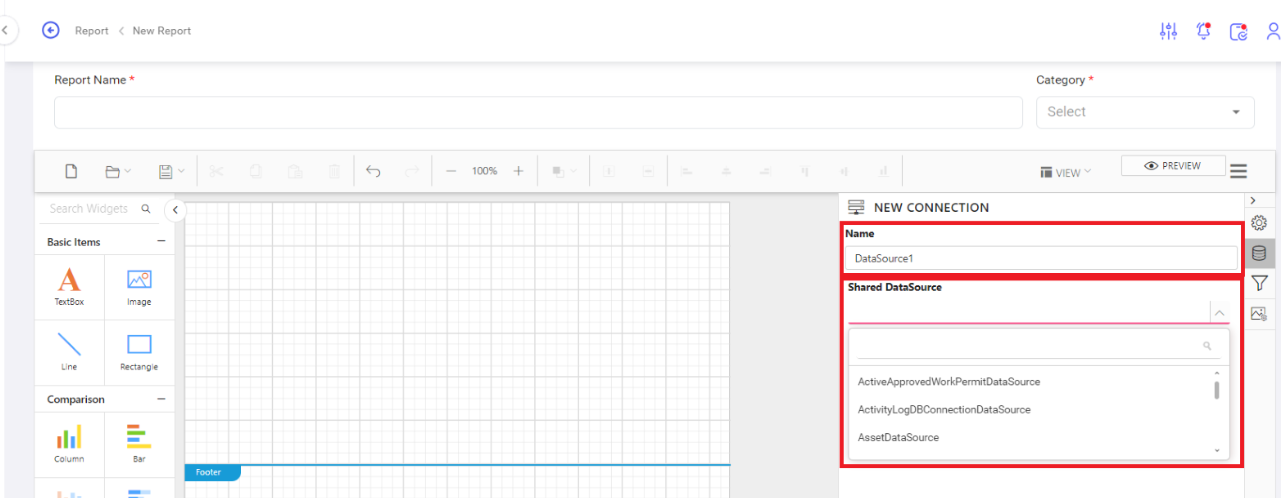
Define the Data source name in a free text field or select the data source from the drop-down menu which is created at the backend & displayed. The data sources are created for all the modules. Clicking on the Save icon will save the Date sources & cancel icon discard the creation process.
Create New Data Sets:
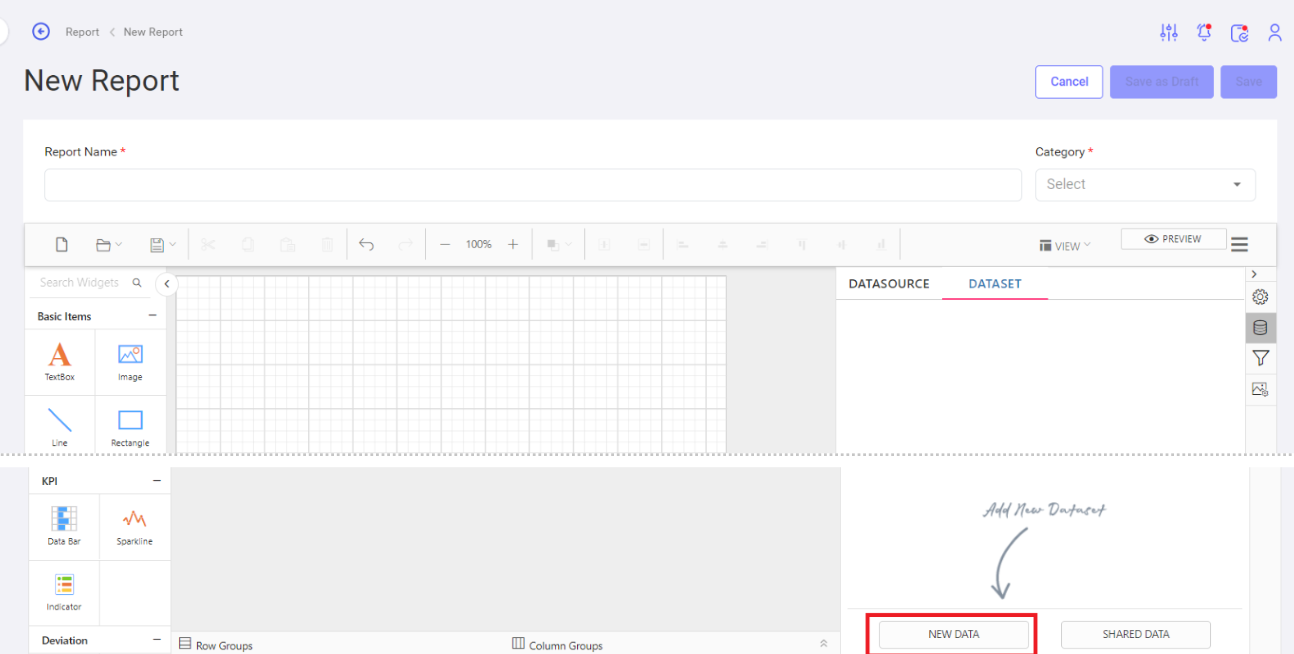
Click on the new data as shown in the image to add a new data set.
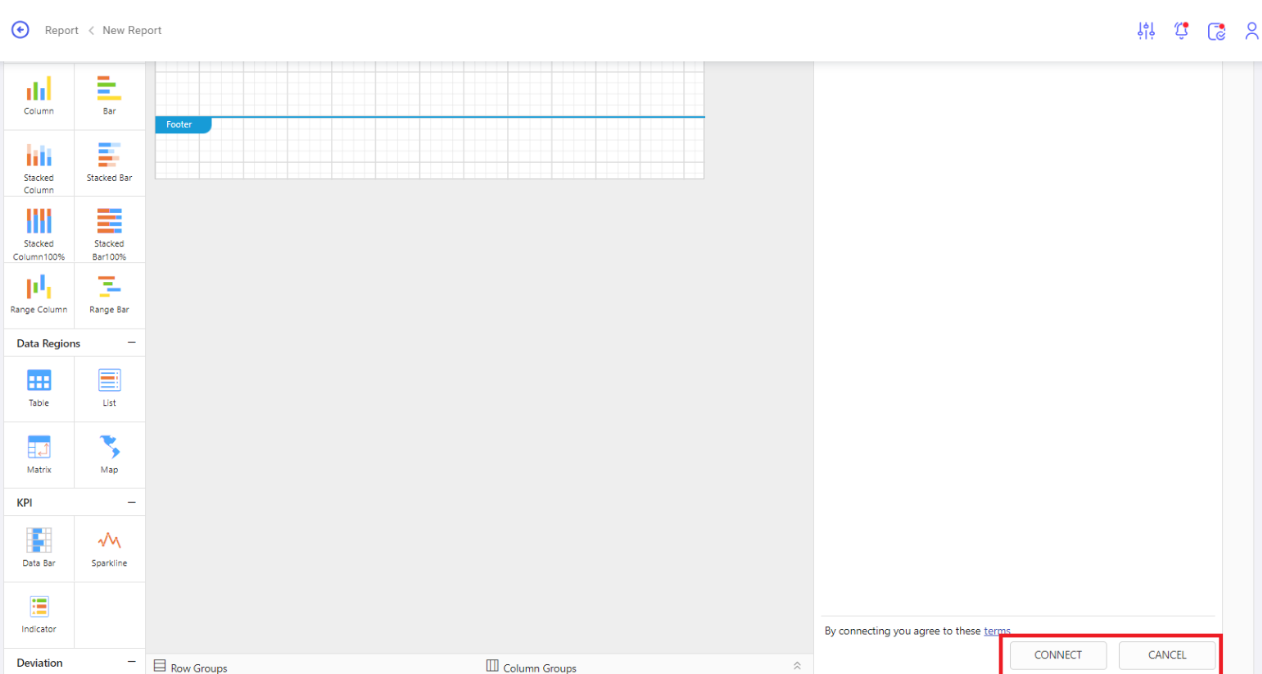
Define the Data source name in a free text field or select the same data source from the drop-down menu which is created at the backend & displayed. Clicking on the Connect icon will connect the Data sets with Data source & cancel icon discard the creation process.
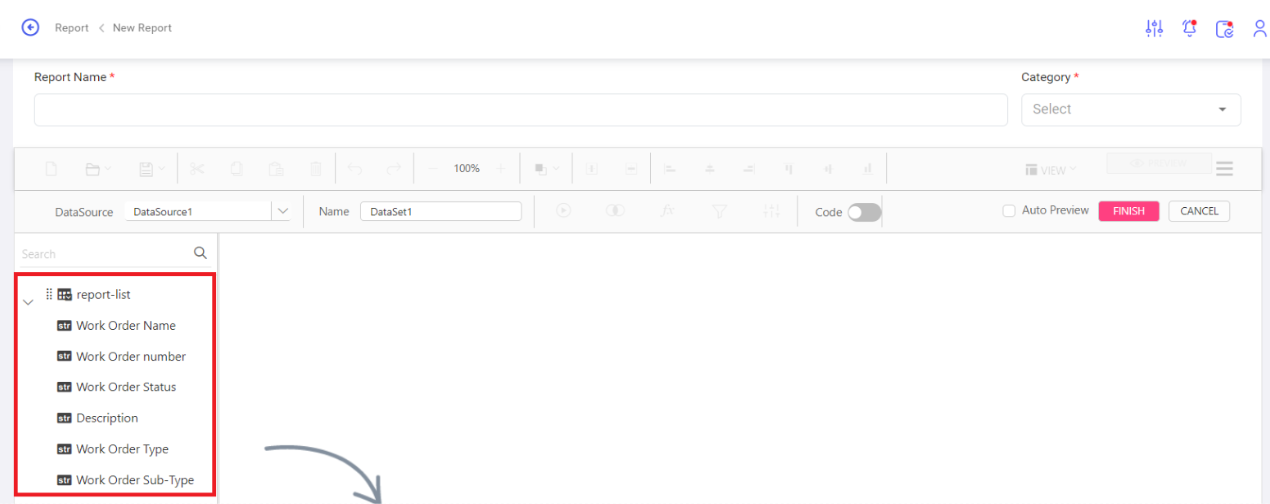
Date set's view in left side panel. User can drag & drop the required data sets / fields to be shown in the report.
Data source to be added to the right panel. To do that:
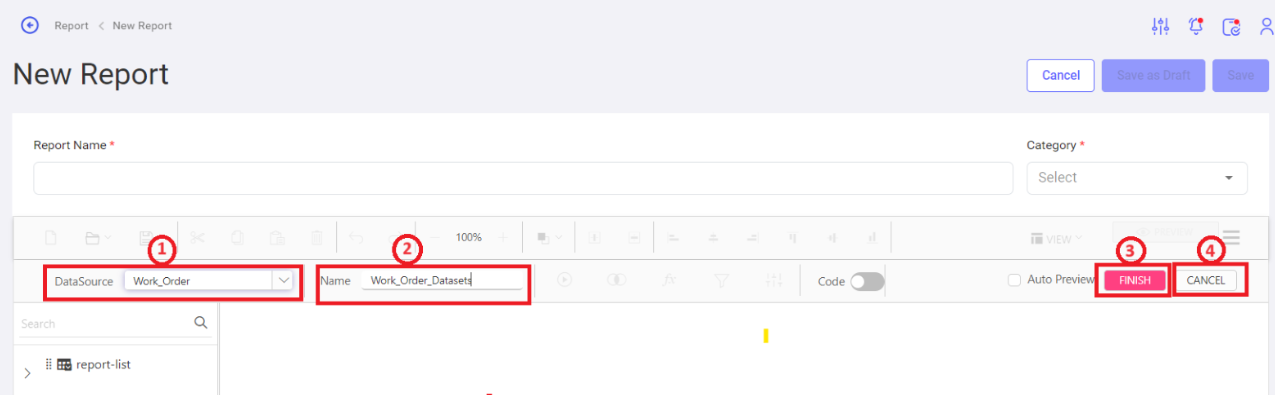
- Data Source: Select the Data source that has been added.
- Name: Define the name.
- Finish: To complete the process.
- Cancel: To discard the process.
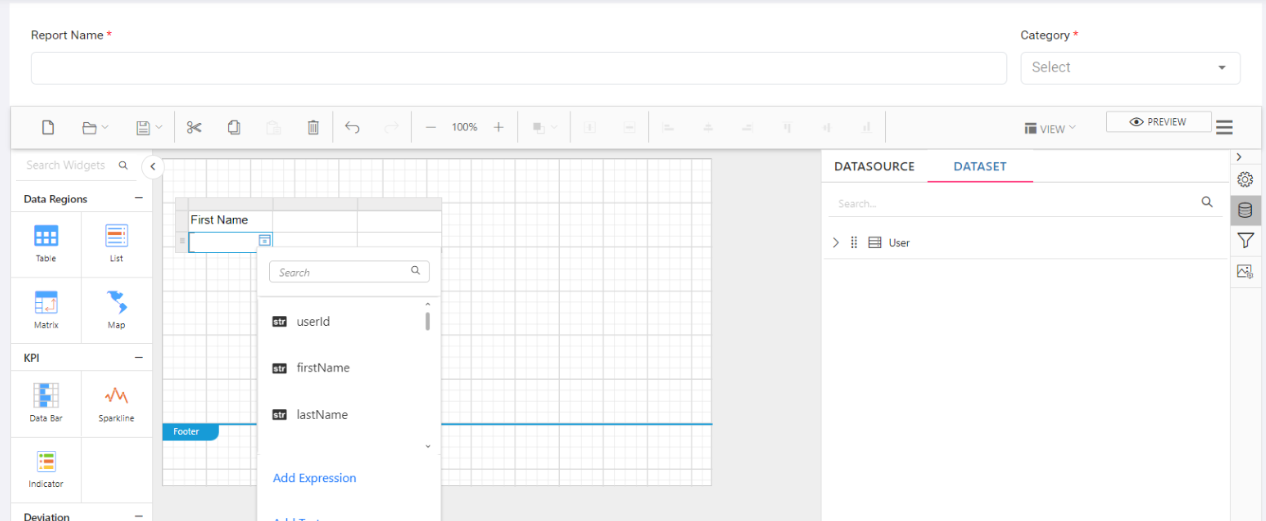
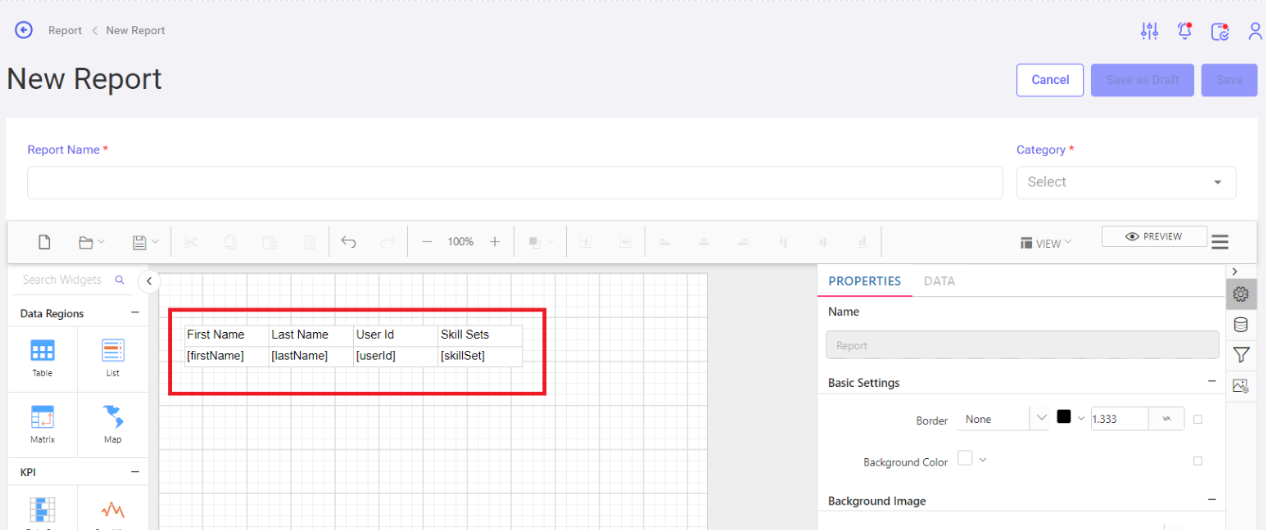
Format Drag & drop:
Drag & drop the format from the widgets required to generate the report. Ex: Table. Then select the field / data sets. If the User wants more columns / rows, or any additional features, they are being provided with more flexibility to use the features.
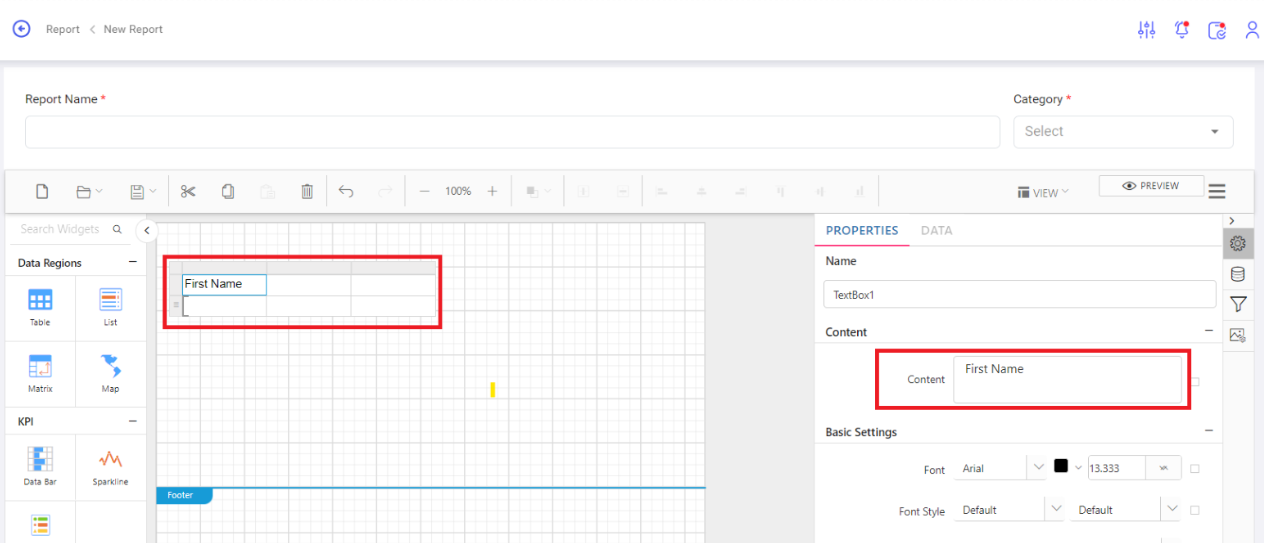
Change the Header of the column:
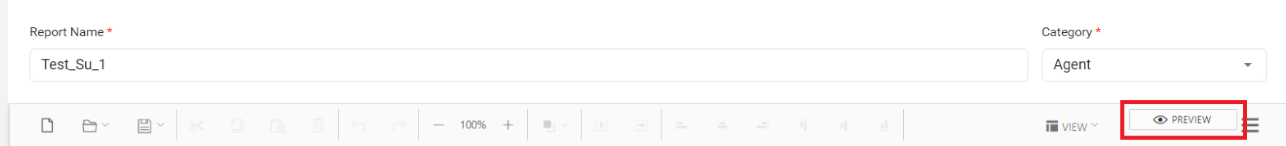
Preview:
Click on the Preview option to view the details.
Details View:
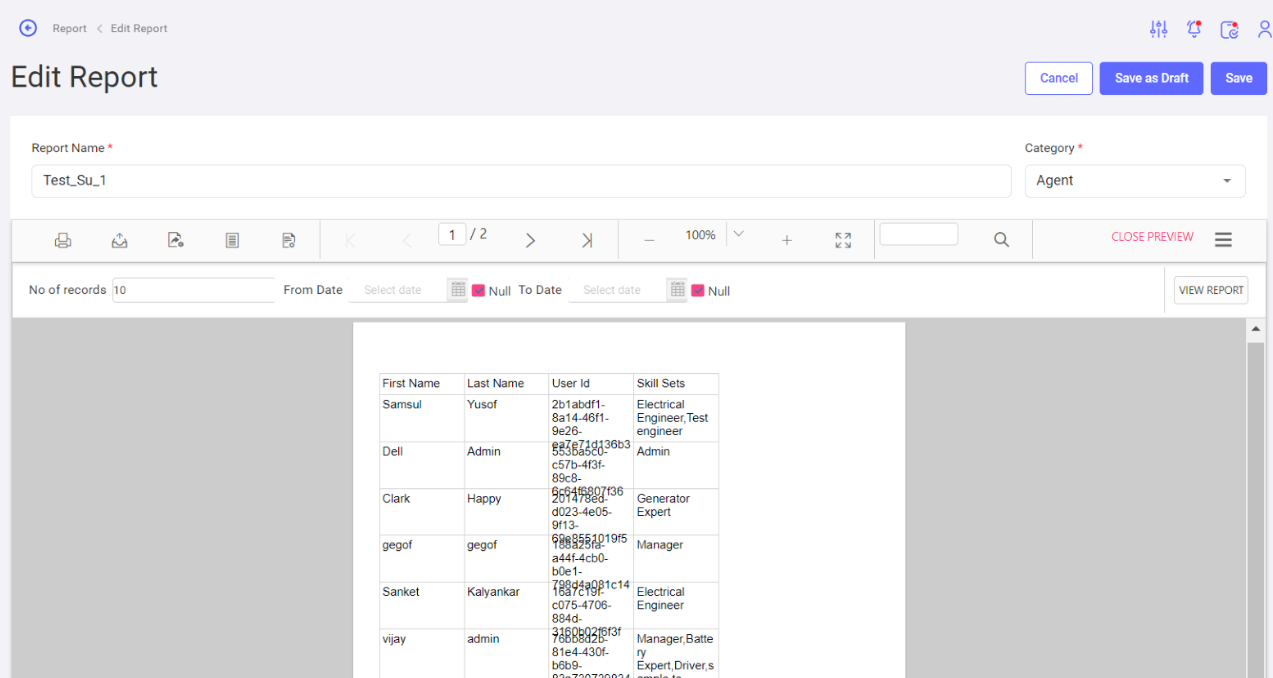
Report view on a dashboard:
4. New Template
New Template:
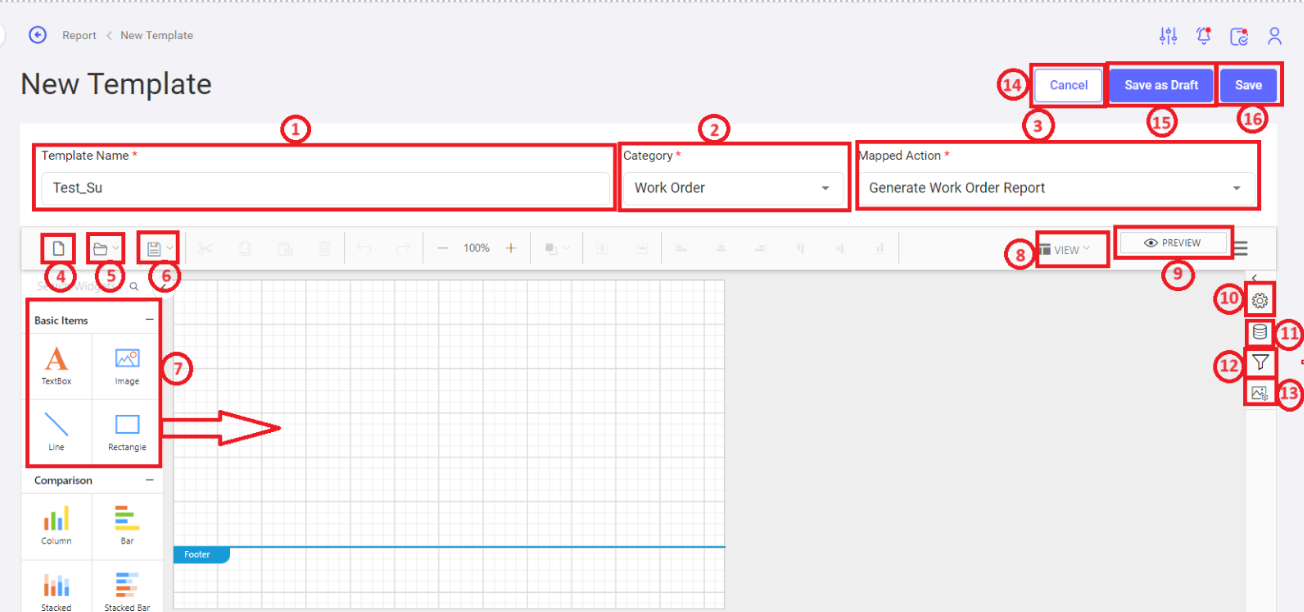
- Template Name: To define the template name.
- Category: To select the category for which the report needs to be generated.
- Mapped Action: Select the mapped action from the drop-down list.
- New: To create a new template.
- Browse Icon: To upload a file from the device or server.
- Save Icon: To save file / save as to device or to server.
- Widgets: To provide flexibility to Users to select the formats to display the data. Ex: Table, Chart etc.
- View: User view options are displayed in the list. The options are Header, Footer, Grid Lines, Snap to Shape, Full Screen.
- Preview: To preview the report template.
- Settings Icon: To do settings as required. Ex: Basic settings, margin, background image etc.
- Data Base Icon: To create new data source & new data sets.
- Filter Parameters: To add filter parameters required for report extraction.
- Image Manager: To add images.
- Cancel: To cancel the report creation process.
- Save as Draft: To save a template as draft.
- Save: To save the template.
Template View:
5. Edit Reports
Edit Reports:
Edit Reports page is like a report creation page.
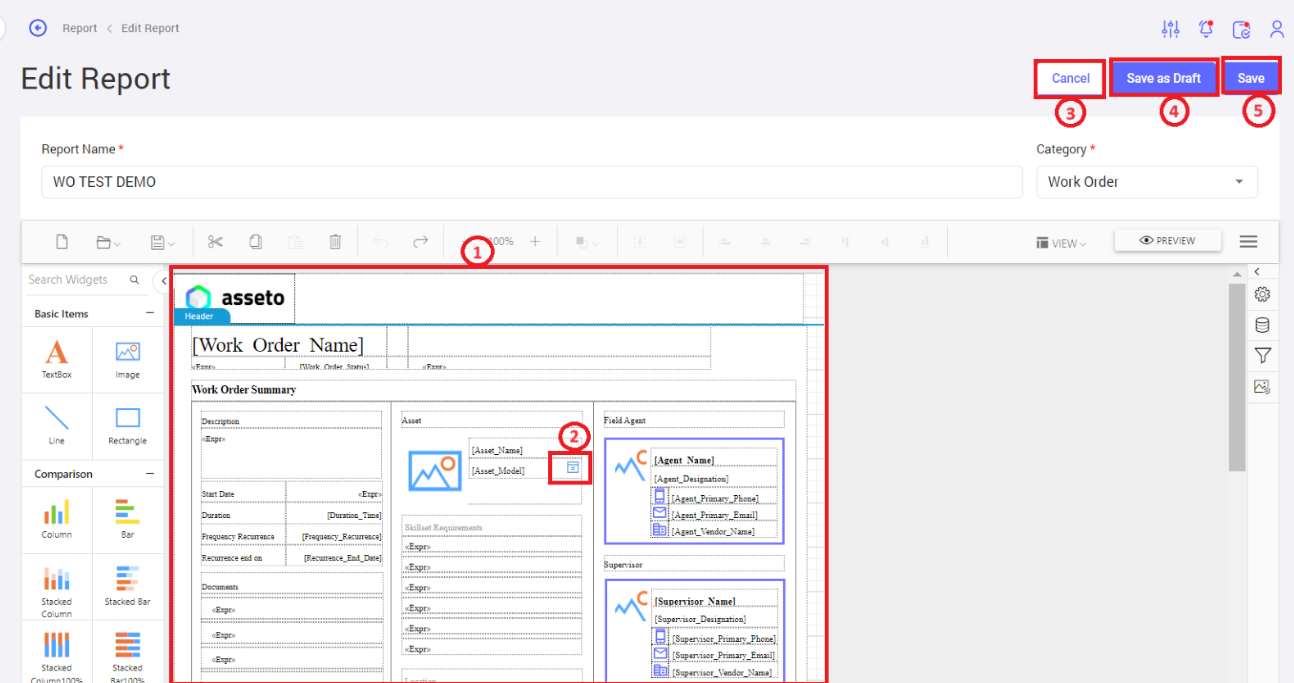
- Existing Report Template view: User can view all the fields available in an existing report template & can edit as required.
- Update icon: User to click on the update icon displays all the fields related to the specific category. User can click on the specific field required to update.
- Cancel: To cancel the editing action.
- Save as draft: To save the changes as draft.
- Save: To save the edited changes.